| From: | Tomas Vondra <tomas(at)vondra(dot)me> |
|---|---|
| To: | Andrei Lepikhov <lepihov(at)gmail(dot)com>, Robert Haas <robertmhaas(at)gmail(dot)com>, Tom Lane <tgl(at)sss(dot)pgh(dot)pa(dot)us> |
| Cc: | PostgreSQL Hackers <pgsql-hackers(at)lists(dot)postgresql(dot)org> |
| Subject: | Re: Subquery pull-up increases jointree search space |
| Date: | 2026-06-13 13:54:01 |
| Message-ID: | c81b64db-0e13-4337-9edf-65a5ef422873@vondra.me |
| Views: | Whole Thread | Raw Message | Download mbox | Resend email |
| Thread: | |
| Lists: | pgsql-hackers |
On 6/8/26 17:27, Tomas Vondra wrote:
> ...
>
> Hmm, how does heaptrack deal with out memory pools? I was worried
> existing memory profilers (like heaptrack) would get confused by our
> memory contexts, attributing the whole block to the palloc that just
> happens to allocate a new block. But that's not really right.
>
> I see the heaptrack README claims it can work with memory pools after
> annotating the code in some way. But there's not much details about
> that. Also, it suggests valgrind/massif can already do that.
>
I took a look at massif - mostly because it comes with valgrind, which
we already use and have the infrastructure in place for (while heaptrack
would be a new dependency, would require new instrumentation etc.).
I think it works pretty well. I'm still not quite sure it does the right
thing with memory contexts (i.e. tracking chunks and not malloc blocks).
We do have the macros (VALGRIND_MEMPOOL_ALLOC, ...) in the right places,
but I saw some malloc() calls in the traces too, which seems wrong.
Anyway, it seems very convenient to use, and gives me data roughly in
line with the manual tracing. It produces much nicer / more complete
reports, and it's way faster (a minute vs. an hour).
Here's how I use it (after building with -DUSE_VALGRIND)
valgrind --trace-children=yes --tool=massif \
--alloc-fn=MemoryContextAlloc \
--alloc-fn=MemoryContextAllocExtended \
--alloc-fn=AllocSetAlloc \
--alloc-fn=AllocSetAllocFromNewBlock \
--alloc-fn=palloc --alloc-fn=palloc0 \
--max-snapshots=1000 --detailed-freq=1 --threshold=0.0 \
postgres ...
Which may be an overkill (e.g. too many detailed snapshots, threshold
too low, ...). But it works. It produces one file per process, I think
you need to exit the process for the file to be written / complete.
Then, to process the massif.out.PID file into a text report:
TMPDIR=./tmp ms_print massif.out.PID > massif.txt
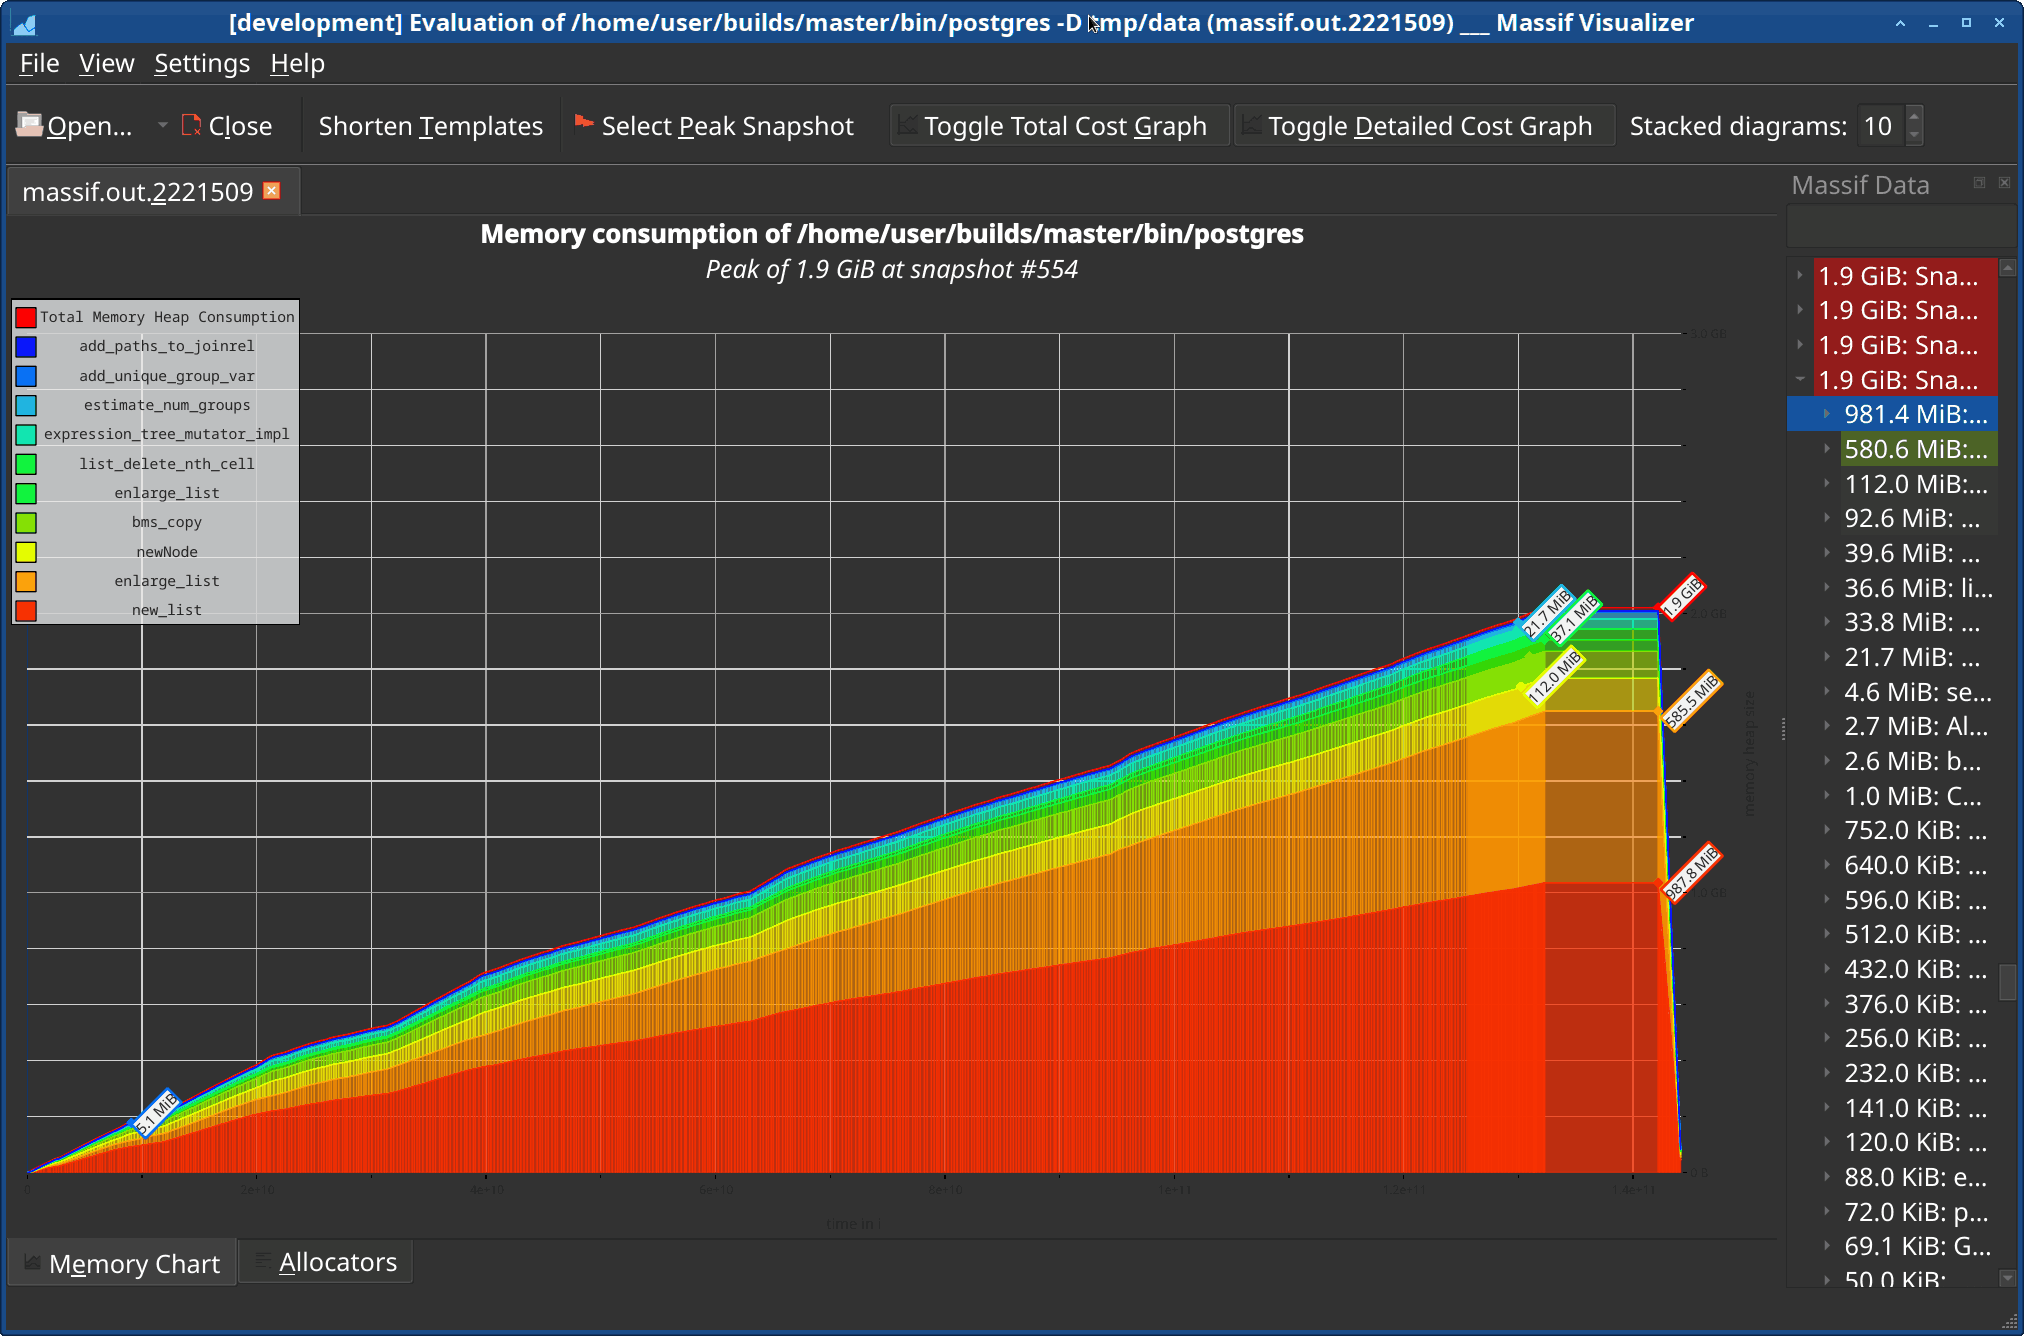
Attached is an example of one of the reports.
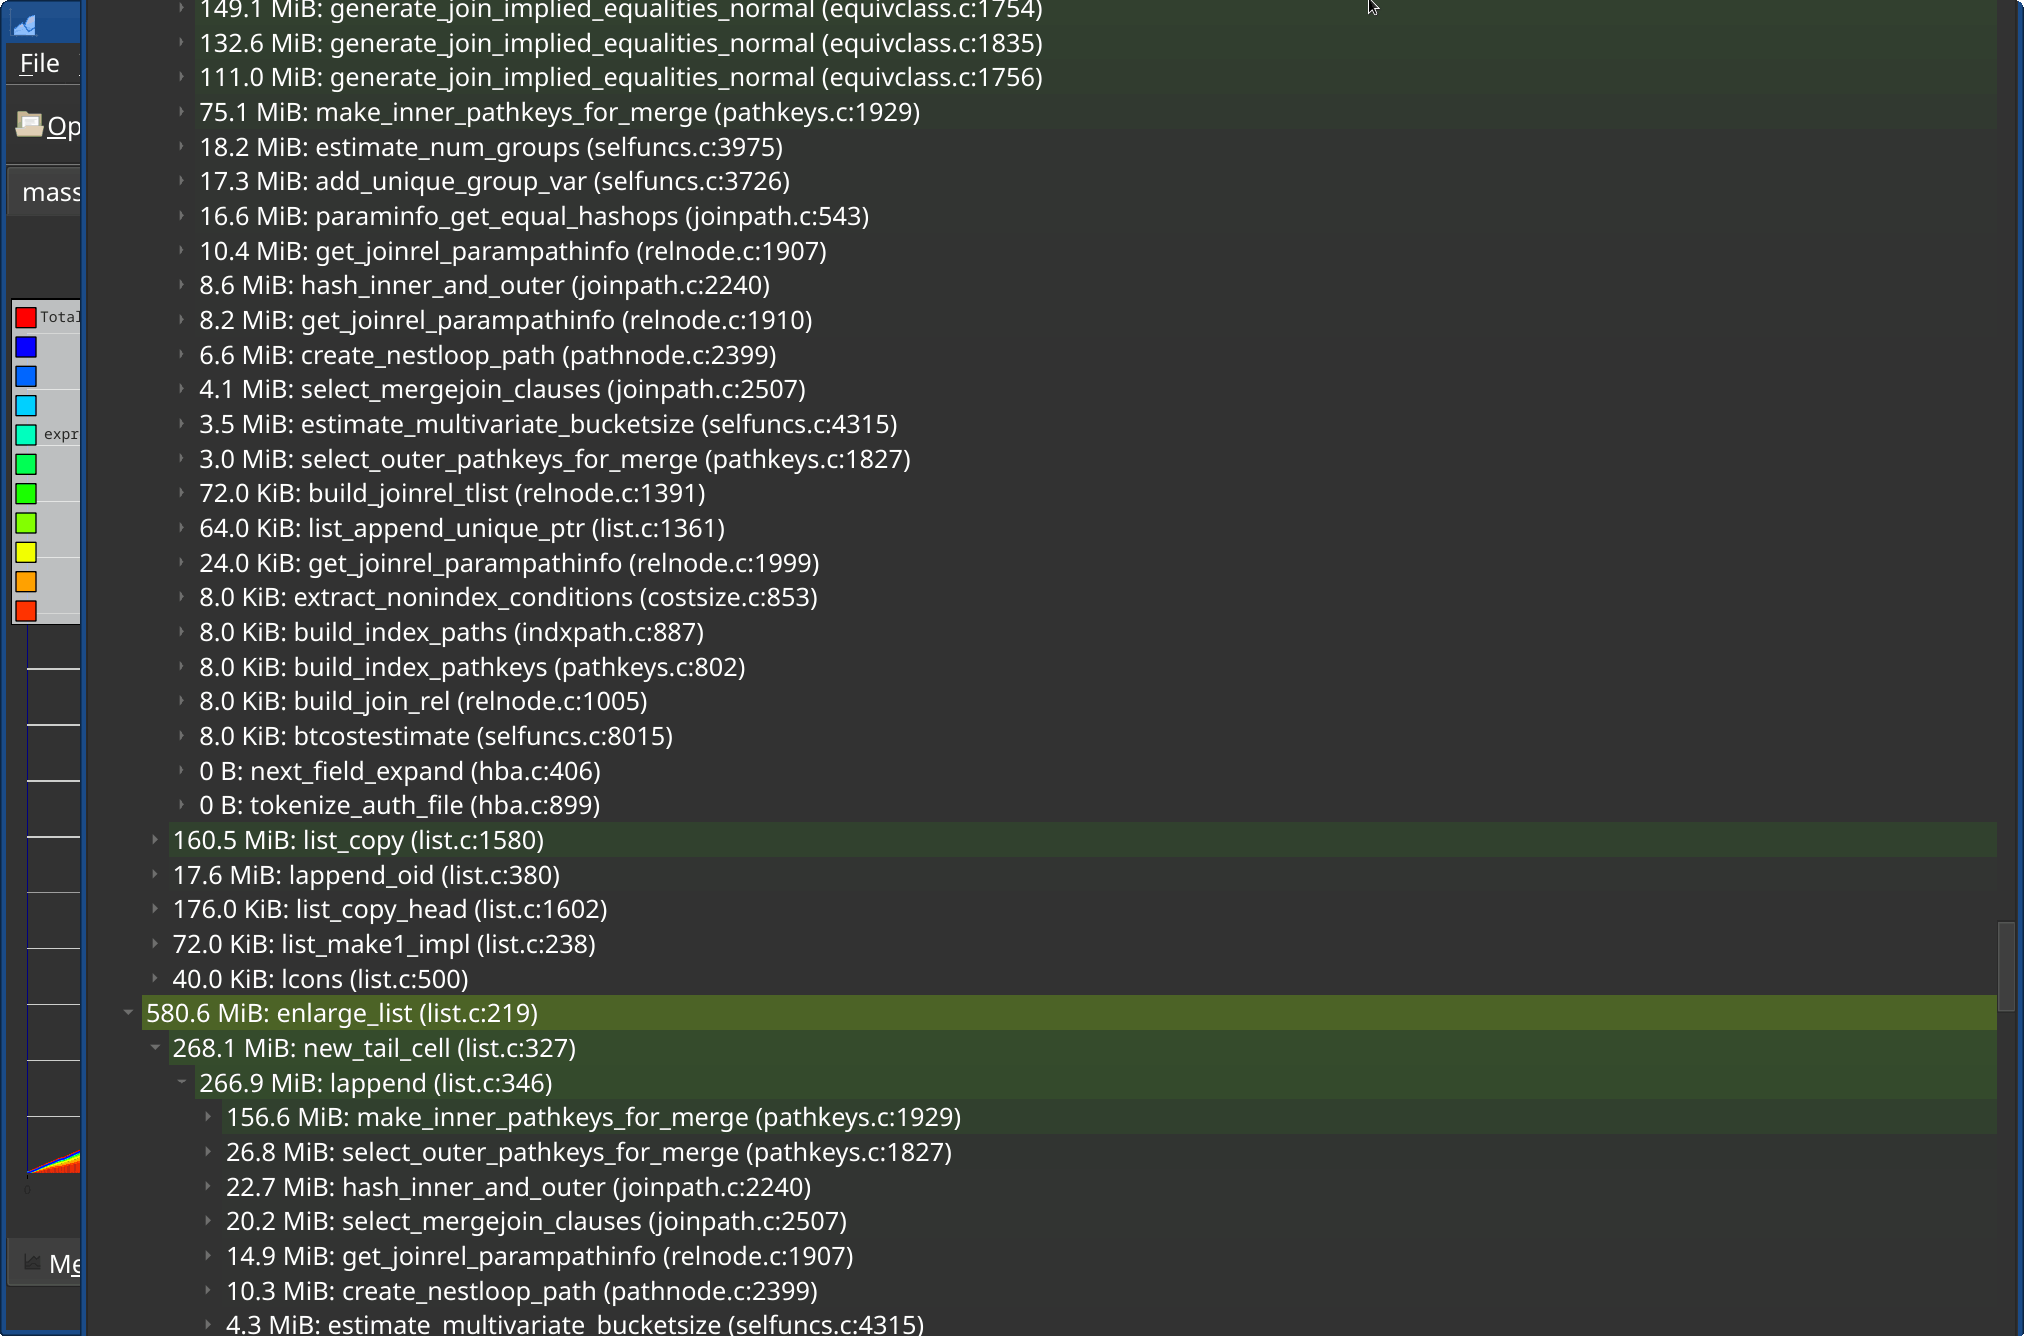
It's also possible to use a massif-visualizer, which shows a nice graph
and allows drilling down to the various places allocating memory.
regards
--
Tomas Vondra
| Attachment | Content-Type | Size |
|---|---|---|
| massif.txt | text/plain | 72.6 KB |
| massif.png | image/png | 91.3 KB |
| massif2.png | image/png | 132.9 KB |
| From | Date | Subject | |
|---|---|---|---|
| Previous Message | ZizhuanLiu X-MAN | 2026-06-13 13:33:46 | Re: Return value of XLogInsertRecord() for XLOG_SWITCH record |