| From: | Gregory Smith <gregsmithpgsql(at)gmail(dot)com> |
|---|---|
| To: | PostgreSQL-development <pgsql-hackers(at)postgresql(dot)org> |
| Subject: | Major pgbench synthetic SELECT workload regression, Ubuntu 23.04+PG15 |
| Date: | 2023-06-08 19:08:57 |
| Message-ID: | CAHLJuCUFGcDb1OkBcLtuWoXv5aPbWMj9uSm3q-AR3CA9CcYp_Q@mail.gmail.com |
| Views: | Whole Thread | Raw Message | Download mbox | Resend email |
| Thread: | |
| Lists: | pgsql-hackers |
Pushing SELECT statements at socket speeds with prepared statements is a
synthetic benchmark that normally demos big pgbench numbers. My benchmark
farm moved to Ubuntu 23.04/kernel 6.2.0-20 last month, and that test is
badly broken on the system PG15 at larger core counts, with as much as an
85% drop from expectations. Since this is really just a benchmark workload
the user impact is very narrow, probably zero really, but as the severity
of the problem is high we should get to the bottom of what's going on.
First round of profile data suggests the lost throughput is going here:
Overhead Shared Object Symbol
74.34% [kernel] [k] osq_lock
2.26% [kernel] [k] mutex_spin_on_owner
While I'd like to just say this is a Linux issue and that's early adopter
life with non-LTS Ubuntu releases, that doesn't explain why a PGDG PG14
works perfectly on the same systems?
Quick test to find if you're impacted: on the server and using sockets,
run a 10 second SELECT test with/without preparation using 1 or 2
clients/[core|thread] and see if preparation is the slower result. Here's
a PGDG PG14 on port 5434 as a baseline, next to Ubuntu 23.04's regular
PG15, all using the PG15 pgbench on AMD 5950X:
$ pgbench -i -s 100 pgbench -p 5434
$ pgbench -S -T 10 -c 32 -j 32 -M prepared -p 5434 pgbench
pgbench (14.8 (Ubuntu 14.8-1.pgdg23.04+1))
tps = 1058195.197298 (without initial connection time)
$ pgbench -S -T 10 -c 32 -j 32 -p 5434 pgbench
pgbench (14.8 (Ubuntu 14.8-1.pgdg23.04+1))
tps = 553120.142503 (without initial connection time)
$ pgbench -i -s 100 pgbench
$ pgbench -S -T 10 -c 32 -j 32 -M prepared pgbench
pgbench (15.3 (Ubuntu 15.3-0ubuntu0.23.04.1))
tps = 170952.097609 (without initial connection time)
$ pgbench -S -T 10 -c 32 -j 32 pgbench
pgbench (15.3 (Ubuntu 15.3-0ubuntu0.23.04.1))
tps = 314585.347022 (without initial connection time)
Connecting over sockets with preparation is usually a cheat code that lets
newer/bigger processors clear a million TPS like I did here. I don't think
that reflects any real use case given the unpopularity of preparation in
ORMs, plus needing a local sockets connection to reach top rates.
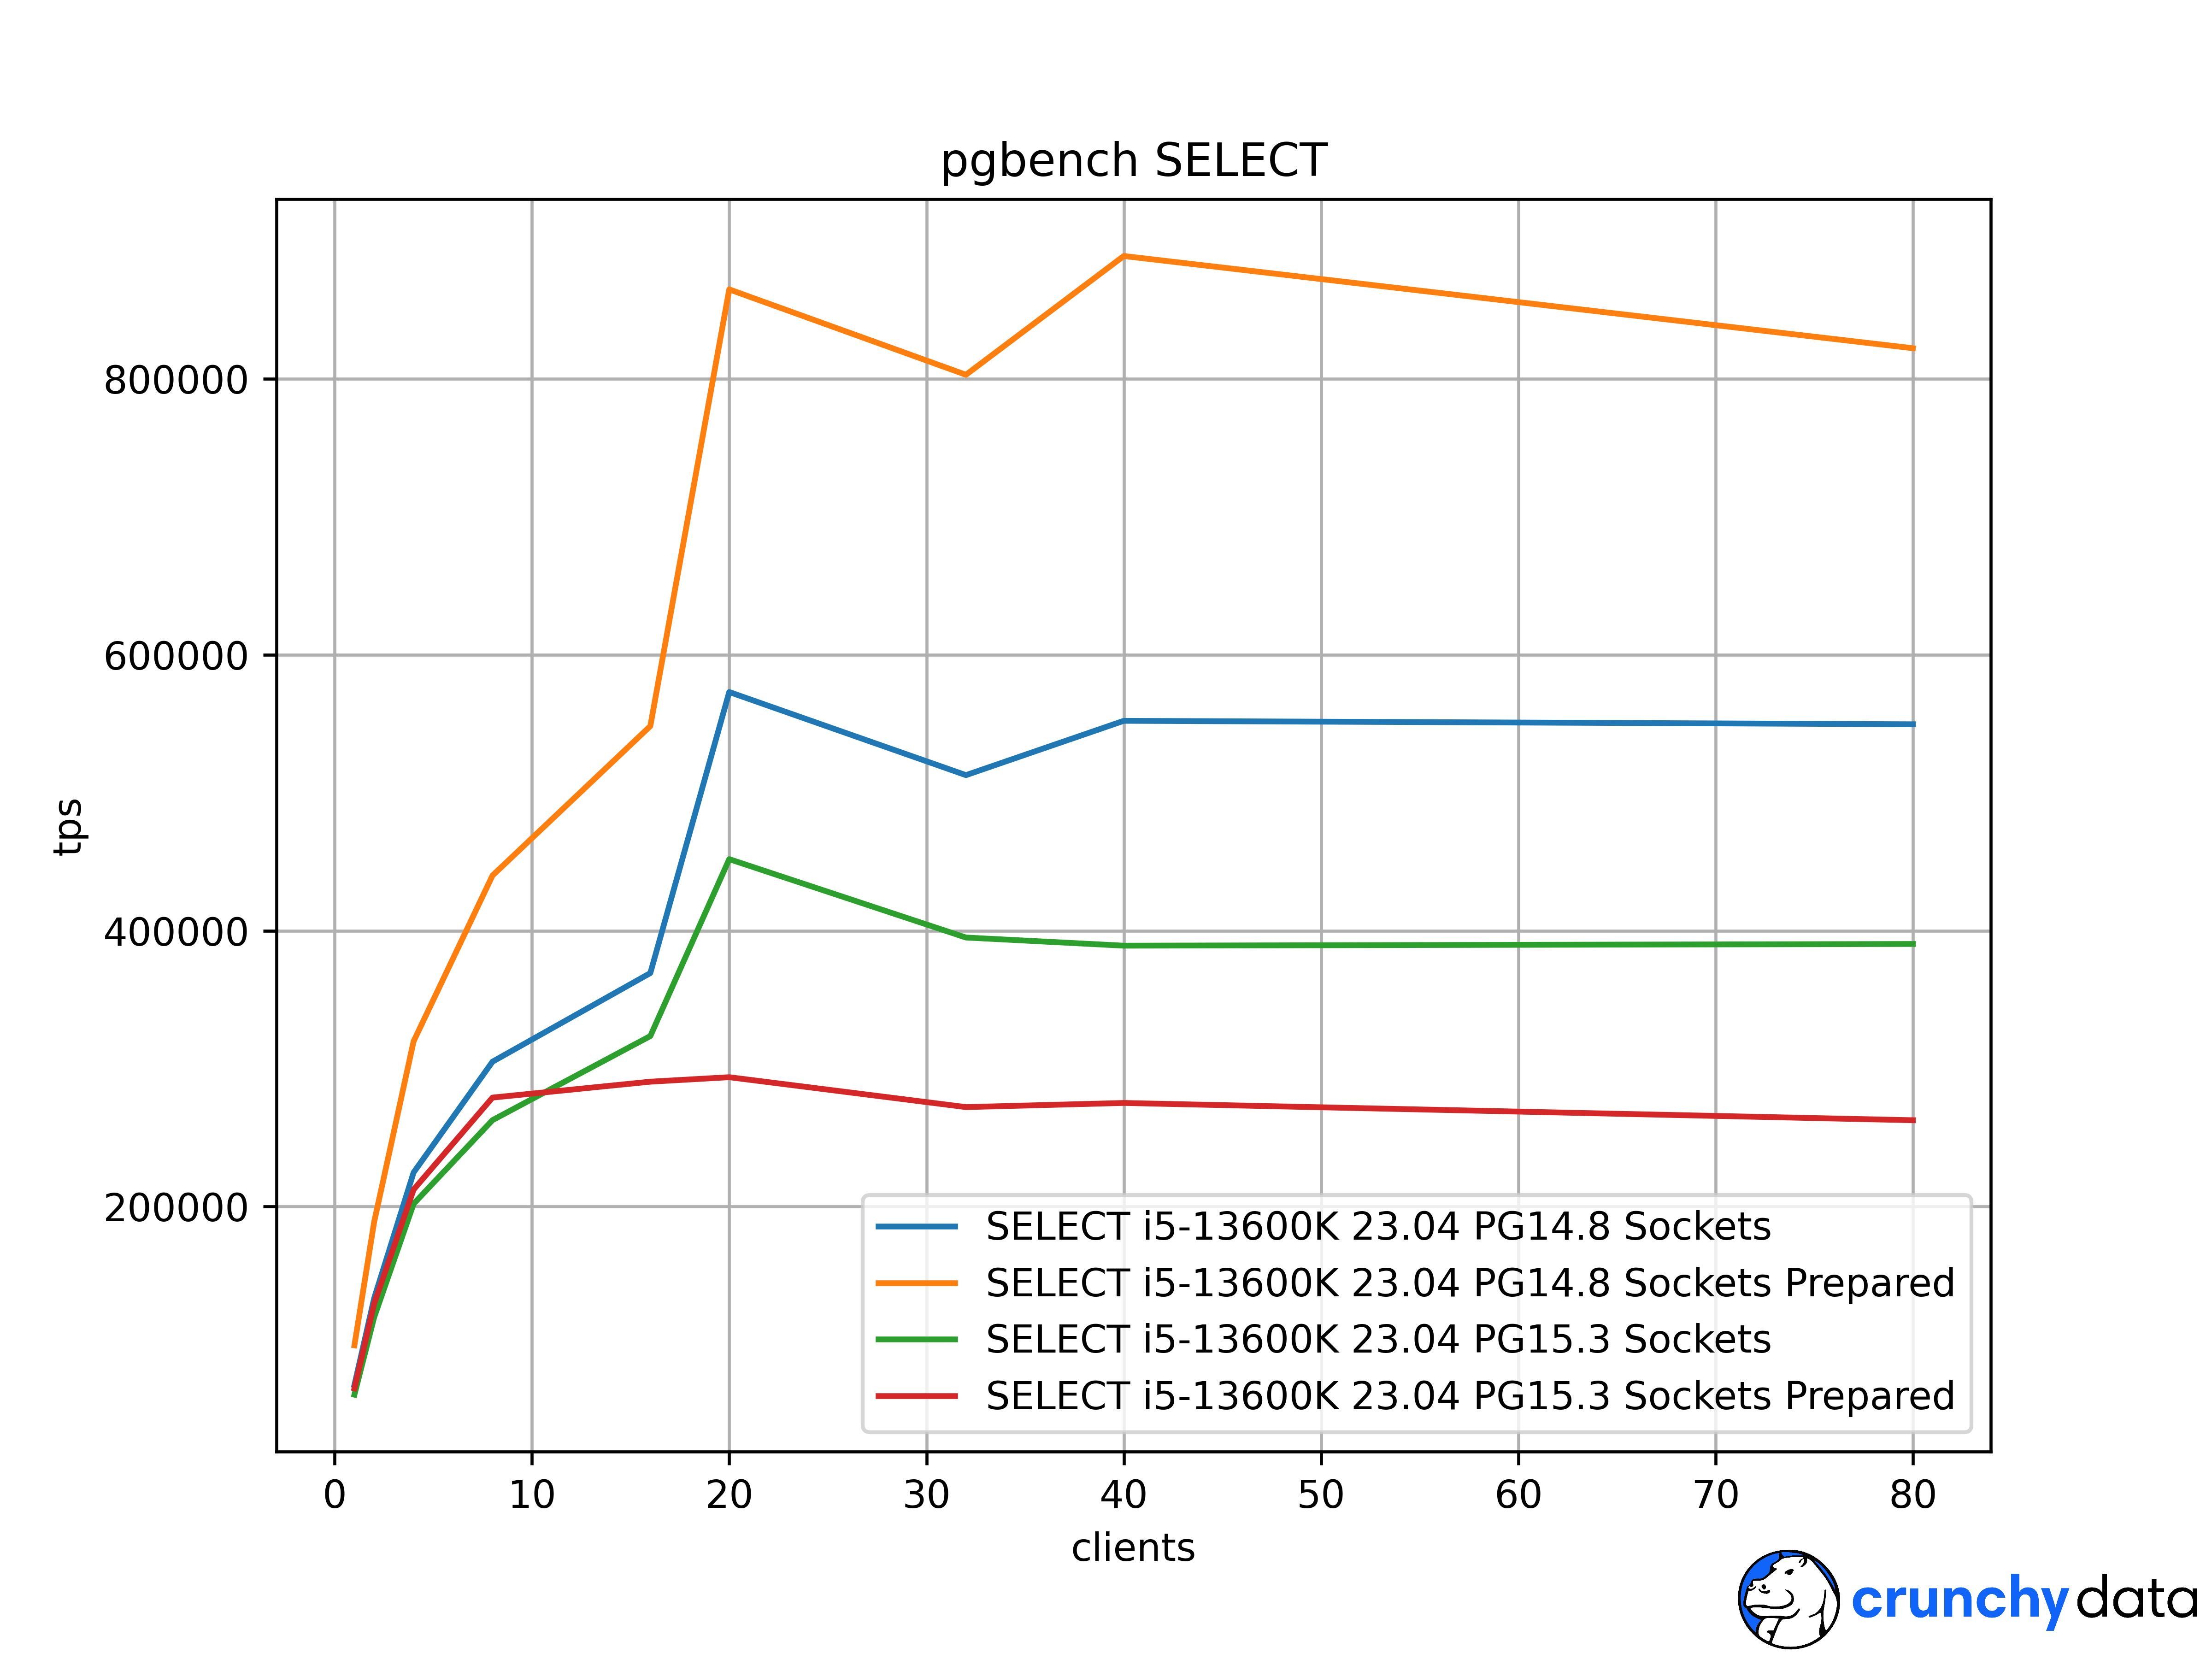
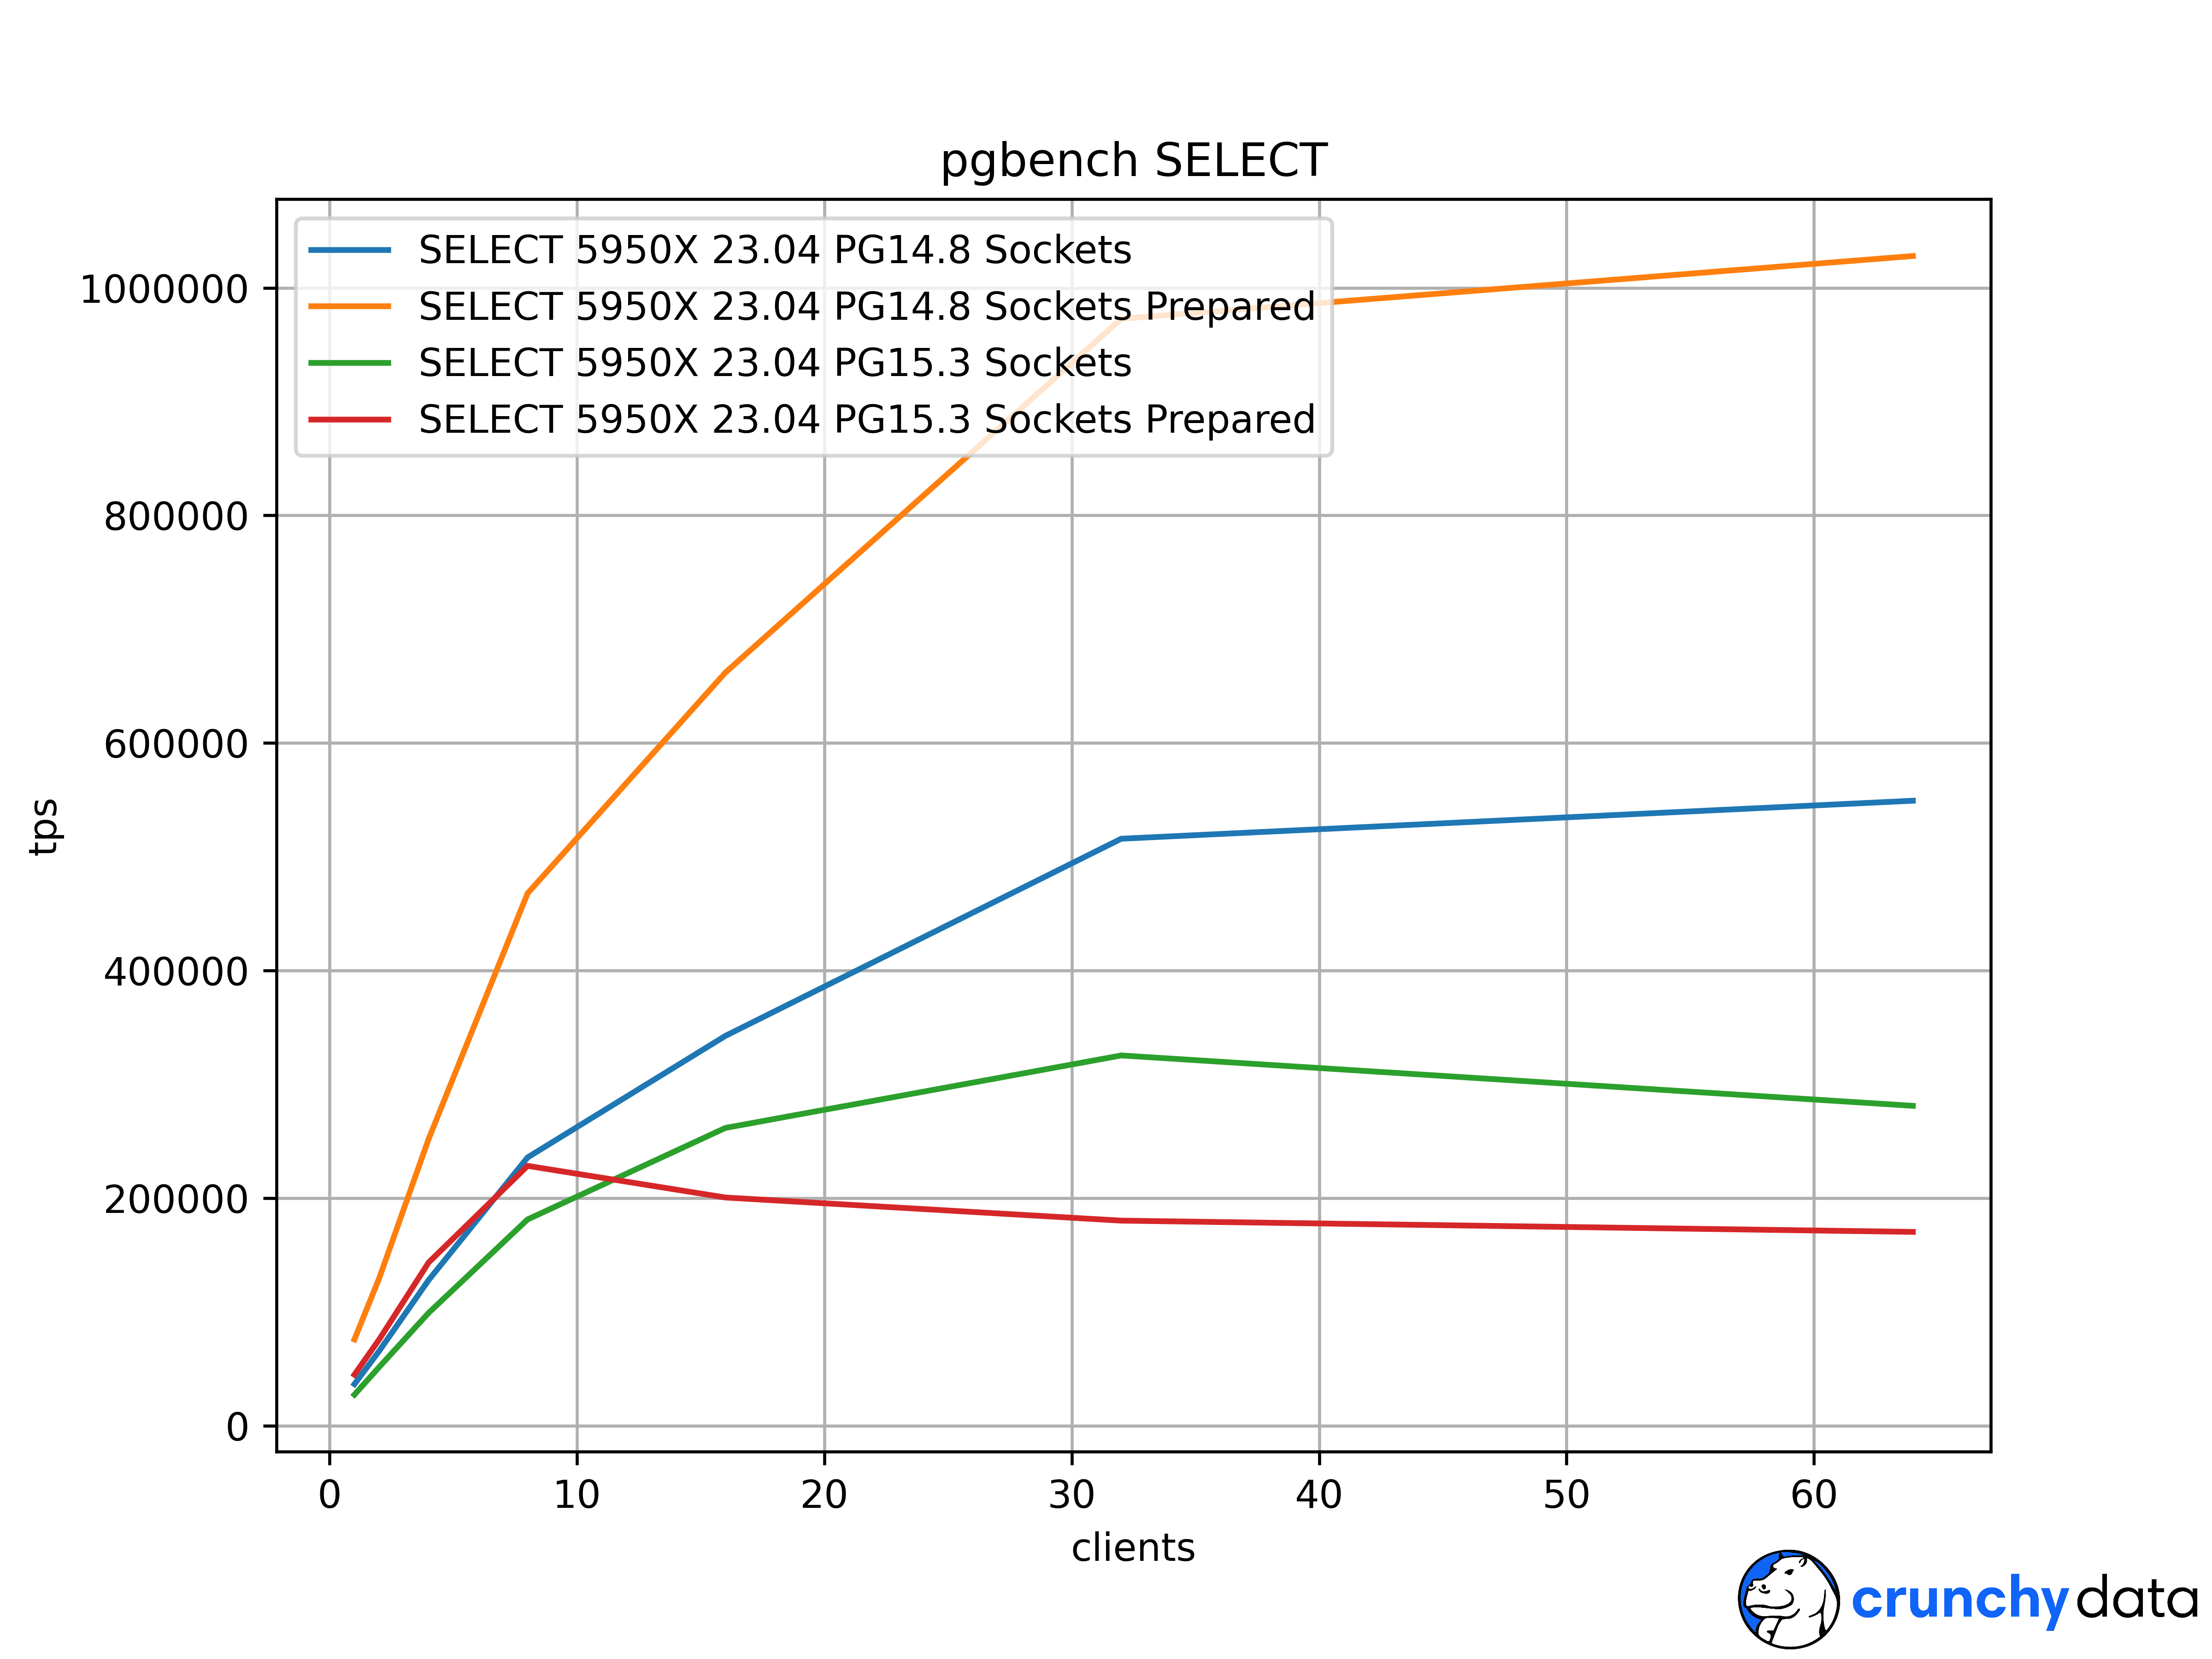
Attached are full scaling graphs for all 4 combinations on this AMD 32
thread 5950X, and an Intel i5-13600K with 20 threads and similar impact.
The regular, unprepared sockets peak speeds took a solid hit in PG15 from
this issue too. I could use some confirmation of where this happens from
other tester's hardware and Linux kernels.
For completeness sake, peaking at "perf top" shows the hottest code
sections for the bad results are:
$ pgbench -S -T 10 -c 32 -j 32 -M prepared pgbench
pgbench (15.3 (Ubuntu 15.3-0ubuntu0.23.04.1))
tps = 170952.097609 (without initial connection time)
Overhead Shared Object Symbol
74.34% [kernel] [k] osq_lock
2.26% [kernel] [k] mutex_spin_on_owner
0.40% postgres [.] _bt_compare
0.27% libc.so.6 [.] __dcigettext
0.24% postgres [.] PostgresMain
$ pgbench -S -T 10 -c 32 -j 32 pgbench
pgbench (15.3 (Ubuntu 15.3-0ubuntu0.23.04.1))
tps = 314585.347022 (without initial connection time)
36.24% [kernel] [k] osq_lock
2.73% [kernel] [k] mutex_spin_on_owner
1.41% postgres [.] base_yyparse
0.73% postgres [.] _bt_compare
0.70% postgres [.] hash_search_with_hash_value
0.62% postgres [.] core_yylex
Here's what good ones look like:
$ pgbench -S -T 10 -c 32 -j 32 -M prepared -p 5434 pgbench
pgbench (14.8 (Ubuntu 14.8-1.pgdg23.04+1))
tps = 1058195.197298 (without initial connection time)
Overhead Shared Object Symbol
2.37% postgres [.] _bt_compare
2.07% [kernel] [k] psi_group_change
1.42% postgres [.] PostgresMain
1.31% postgres [.] hash_search_with_hash_value
1.08% [kernel] [k] __update_load_avg_se
$ pgbench -S -T 10 -c 32 -j 32 -p 5434 pgbench
pgbench (14.8 (Ubuntu 14.8-1.pgdg23.04+1))
tps = 553120.142503 (without initial connection time)
2.35% postgres [.] base_yyparse
1.37% postgres [.] _bt_compare
1.11% postgres [.] core_yylex
1.09% [kernel] [k] psi_group_change
0.99% postgres [.] hash_search_with_hash_value
There's been plenty of recent chatter on LKML about *osq_lock*, in January
Intel reported a 20% benchmark regression on UnixBench that might be
related. Work is still ongoing this week:
https://lore.kernel.org/linux-mm/202301301057(dot)e55dad5b-oliver(dot)sang(at)intel(dot)com/
https://lkml.org/lkml/2023/6/6/706
Seems time to join that party! Probably going to roll back the Intel
system to 22.04 just so I can finish 16b1 tests on schedule on that one.
(I only moved to 23.04 to get a major update to AMD's pstate kernel driver,
which went great until hitting this test) Also haven't checked yet if the
PGDG PG15 is any different from the stock Ubuntu one; wanted to get this
report out first.
--
Greg Smith greg(dot)smith(at)crunchydata(dot)com
Director of Open Source Strategy
| Attachment | Content-Type | Size |
|---|---|---|
| twilight.png | image/png | 495.0 KB |
| rising.png | image/png | 479.1 KB |
| From | Date | Subject | |
|---|---|---|---|
| Next Message | Thomas Munro | 2023-06-08 19:10:35 | Re: Let's make PostgreSQL multi-threaded |
| Previous Message | Peter Geoghegan | 2023-06-08 18:56:28 | Re: index prefetching |