Re: [REVIEW] Re: Compression of full-page-writes
| From: | Rahila Syed <rahilasyed90(at)gmail(dot)com> |
|---|---|
| To: | Arthur Silva <arthurprs(at)gmail(dot)com> |
| Cc: | Fujii Masao <masao(dot)fujii(at)gmail(dot)com>, Rahila Syed <rahilasyed(dot)90(at)gmail(dot)com>, Robert Haas <robertmhaas(at)gmail(dot)com>, Abhijit Menon-Sen <ams(at)2ndquadrant(dot)com>, PostgreSQL-development <pgsql-hackers(at)postgresql(dot)org>, Andres Freund <andres(at)2ndquadrant(dot)com> |
| Subject: | Re: [REVIEW] Re: Compression of full-page-writes |
| Date: | 2014-09-02 12:11:31 |
| Message-ID: | CAH2L28ujNJdt=h3eJu=1wa7yN87sf5Y0k93B_s1iJRc4t-2_FQ@mail.gmail.com |
| Views: | Whole Thread | Raw Message | Download mbox | Resend email |
| Thread: | |
| Lists: | pgsql-hackers |
Hello,
>It'd be interesting to check avg cpu usage as well
I have collected average CPU utilization numbers by collecting sar output
at interval of 10 seconds for following benchmark:
Server specifications:
Processors:Intel® Xeon ® Processor E5-2650 (2 GHz, 8C/16T, 20 MB) * 2 nos
RAM: 32GB
Disk : HDD 450GB 10K Hot Plug 2.5-inch SAS HDD * 8 nos
1 x 450 GB SAS HDD, 2.5-inch, 6Gb/s, 10,000 rpm
Benchmark:
Scale : 16
Command :java JR /home/postgres/jdbcrunner-1.2/scripts/tpcc.js
-sleepTime 550,250,250,200,200
Warmup time : 1 sec
Measurement time : 900 sec
Number of tx types : 5
Number of agents : 16
Connection pool size : 16
Statement cache size : 40
Auto commit : false
Checkpoint segments:1024
Checkpoint timeout:5 mins
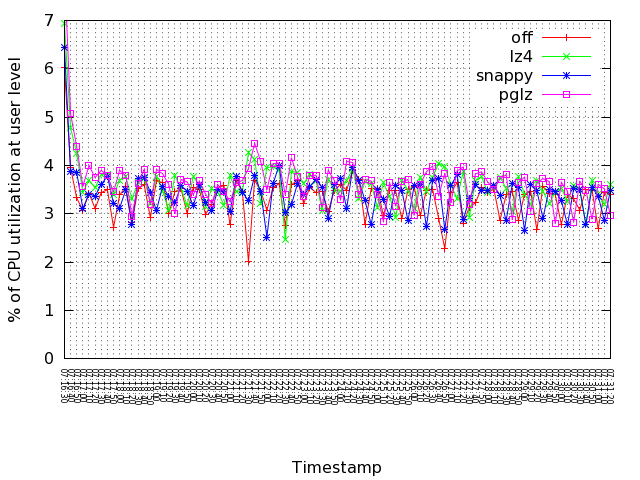
Average % of CPU utilization at user level for multiple blocks compression:
Compression Off = 3.34133
Snappy = 3.41044
LZ4 = 3.59556
Pglz = 3.66422
The numbers show the average CPU utilization is in the following order pglz
> LZ4 > Snappy > No compression
Attached is the graph which gives plot of % CPU utilization versus time
elapsed for each of the compression algorithms.
Also, the overall CPU utilization during tests is very low i.e below 10% .
CPU remained idle for large(~90) percentage of time. I will repeat the
above tests with high load on CPU and using the benchmark given by
Fujii-san and post the results.
Thank you,
On Wed, Aug 27, 2014 at 9:16 PM, Arthur Silva <arthurprs(at)gmail(dot)com> wrote:
>
> Em 26/08/2014 09:16, "Fujii Masao" <masao(dot)fujii(at)gmail(dot)com> escreveu:
>
> >
> > On Tue, Aug 19, 2014 at 6:37 PM, Rahila Syed <rahilasyed90(at)gmail(dot)com>
> wrote:
> > > Hello,
> > > Thank you for comments.
> > >
> > >>Could you tell me where the patch for "single block in one run" is?
> > > Please find attached patch for single block compression in one run.
> >
> > Thanks! I ran the benchmark using pgbench and compared the results.
> > I'd like to share the results.
> >
> > [RESULT]
> > Amount of WAL generated during the benchmark. Unit is MB.
> >
> > Multiple Single
> > off 202.0 201.5
> > on 6051.0 6053.0
> > pglz 3543.0 3567.0
> > lz4 3344.0 3485.0
> > snappy 3354.0 3449.5
> >
> > Latency average during the benchmark. Unit is ms.
> >
> > Multiple Single
> > off 19.1 19.0
> > on 55.3 57.3
> > pglz 45.0 45.9
> > lz4 44.2 44.7
> > snappy 43.4 43.3
> >
> > These results show that FPW compression is really helpful for decreasing
> > the WAL volume and improving the performance.
> >
> > The compression ratio by lz4 or snappy is better than that by pglz. But
> > it's difficult to conclude which lz4 or snappy is best, according to
> these
> > results.
> >
> > ISTM that compression-of-multiple-pages-at-a-time approach can compress
> > WAL more than compression-of-single-... does.
> >
> > [HOW TO BENCHMARK]
> > Create pgbench database with scall factor 1000.
> >
> > Change the data type of the column "filler" on each pgbench table
> > from CHAR(n) to TEXT, and fill the data with the result of pgcrypto's
> > gen_random_uuid() in order to avoid empty column, e.g.,
> >
> > alter table pgbench_accounts alter column filler type text using
> > gen_random_uuid()::text
> >
> > After creating the test database, run the pgbench as follows. The
> > number of transactions executed during benchmark is almost same
> > between each benchmark because -R option is used.
> >
> > pgbench -c 64 -j 64 -r -R 400 -T 900 -M prepared
> >
> > checkpoint_timeout is 5min, so it's expected that checkpoint was
> > executed at least two times during the benchmark.
> >
> > Regards,
> >
> > --
> > Fujii Masao
> >
> >
> > --
> > Sent via pgsql-hackers mailing list (pgsql-hackers(at)postgresql(dot)org)
> > To make changes to your subscription:
> > http://www.postgresql.org/mailpref/pgsql-hackers
>
> It'd be interesting to check avg cpu usage as well.
>
| Attachment | Content-Type | Size |
|---|---|---|
|
image/png | 68.7 KB |
In response to
- Re: [REVIEW] Re: Compression of full-page-writes at 2014-08-27 15:46:14 from Arthur Silva
Responses
- Re: [REVIEW] Re: Compression of full-page-writes at 2014-09-02 13:30:11 from Arthur Silva
- Re: [REVIEW] Re: Compression of full-page-writes at 2014-09-11 05:46:21 from Rahila Syed
Browse pgsql-hackers by date
| From | Date | Subject | |
|---|---|---|---|
| Next Message | Joel Jacobson | 2014-09-02 12:16:31 | Re: PL/pgSQL 2 |
| Previous Message | Jeevan Chalke | 2014-09-02 11:54:42 | Re: Re: proposal: ignore null fields in not relation type composite type based constructors |