Re: very high replay_lag on 3-node cluster
| From: | Tiemen Ruiten <t(dot)ruiten(at)tech-lab(dot)io> |
|---|---|
| To: | "Jehan-Guillaume (ioguix) de Rorthais" <ioguix(at)free(dot)fr> |
| Cc: | pgsql-general(at)lists(dot)postgresql(dot)org |
| Subject: | Re: very high replay_lag on 3-node cluster |
| Date: | 2019-07-22 10:58:47 |
| Message-ID: | CAEkBuzeDHX4PSb4SirzHhWhjsPeCuWdbOByvR=5UrK5Rx0ZxYA@mail.gmail.com |
| Views: | Whole Thread | Raw Message | Download mbox | Resend email |
| Thread: | |
| Lists: | pgsql-general |
On Mon, Jul 22, 2019 at 11:28 AM Jehan-Guillaume (ioguix) de Rorthais <
ioguix(at)free(dot)fr> wrote:
> Hi,
>
> On Mon, 22 Jul 2019 11:05:57 +0200
> Tiemen Ruiten <t(dot)ruiten(at)tech-lab(dot)io> wrote:
> [...]
> > > Now to my current issue: I took the advice to add more monitoring on
> > > replay lag (using pg_last_xact_replay_timestamp) and things are not
> looking
> > > good. Last night replication lagged by almost 6 hours on one of the
> > > nodes[3], but eventually caught up. As you can see in that screenshot,
> > > ph-sql-03 is consistently slower to replay than ph-sql-05 (ph-sql-04
> is the
> > > current master) and there happen to be different SSD's in ph-sql-03
> > > (Crucial MX300 vs Crucial MX500 in the other two), which makes me think
> > > this is IO related.
>
> Such a difference is quite surprising. Moreover, I suppose you have some
> caching in front of disks (either RAID or SAN?). Could you describe your
> disk
> stack with more details?
>
> Do you have any detailed metrics about disks and network IO to share?
>
> The network is the same for both nodes?
>
Hi!
All nodes have only local storage. The filesystem is ZFS, which has its own
builtin caching (ARC/L2ARC & ZIL). There are no hardware caching devices
present. The disks are connected using a Supermicro AOC-S3008L-L8E HBA
(shown as LSI Logic / Symbios Logic SAS3008 PCI-Express Fusion-MPT SAS-3
(rev 02) with lspci). This is the layout of the pool:
[root(at)ph-sql-04 ter]# zpool status
pool: tank
state: ONLINE
scan: scrub repaired 0B in 0 days 00:07:51 with 0 errors on Tue Jul 16
03:17:52 2019
config:
NAME STATE READ WRITE CKSUM
tank ONLINE 0 0 0
mirror-0 ONLINE 0 0 0
sda ONLINE 0 0 0
sdb ONLINE 0 0 0
mirror-1 ONLINE 0 0 0
sdc ONLINE 0 0 0
sdd ONLINE 0 0 0
mirror-2 ONLINE 0 0 0
sde ONLINE 0 0 0
sdf ONLINE 0 0 0
mirror-3 ONLINE 0 0 0
sdg ONLINE 0 0 0
sdh ONLINE 0 0 0
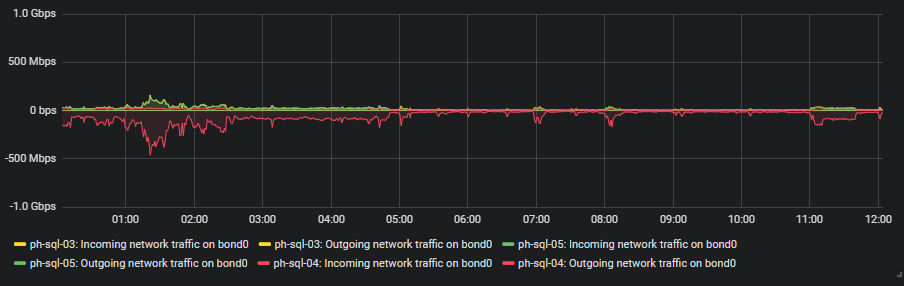
I've attached a graph of network IO on all servers. The network config is
identical for all three nodes: 2x bonded gigabit connection to the same
stacked switch pair.
Currently I don't have much metrics on raw disk IO, I can add some
monitoring items and report those tomorrow if that would be useful. I do
have a lot of metrics available related to PostgreSQL (buffers
written/read, checkpoints, rows fetched/updated/inserted etc.)
| Attachment | Content-Type | Size |
|---|---|---|
|
image/png | 37.7 KB |
In response to
- Re: very high replay_lag on 3-node cluster at 2019-07-22 09:27:54 from Jehan-Guillaume (ioguix) de Rorthais
Responses
- Re: very high replay_lag on 3-node cluster at 2019-07-22 14:12:28 from Jehan-Guillaume (ioguix) de Rorthais
Browse pgsql-general by date
| From | Date | Subject | |
|---|---|---|---|
| Next Message | Rory Campbell-Lange | 2019-07-22 13:06:04 | Re: How to run a task continuously in the background |
| Previous Message | Jehan-Guillaume (ioguix) de Rorthais | 2019-07-22 09:27:54 | Re: very high replay_lag on 3-node cluster |