Re: Lock timeouts and unusual spikes in replication lag with logical parallel transaction streaming
| From: | Zane Duffield <duffieldzane(at)gmail(dot)com> |
|---|---|
| To: | "Zhijie Hou (Fujitsu)" <houzj(dot)fnst(at)fujitsu(dot)com> |
| Cc: | "pgsql-bugs(at)lists(dot)postgresql(dot)org" <pgsql-bugs(at)lists(dot)postgresql(dot)org>, Amit Kapila <amit(dot)kapila16(at)gmail(dot)com> |
| Subject: | Re: Lock timeouts and unusual spikes in replication lag with logical parallel transaction streaming |
| Date: | 2025-08-20 05:38:34 |
| Message-ID: | CACMiCkXFpReXpyCdUa4k4oVYioc5SLsP2gkHKMVt2xL_pd3HHQ@mail.gmail.com |
| Views: | Whole Thread | Raw Message | Download mbox | Resend email |
| Thread: | |
| Lists: | pgsql-bugs |
Firstly, I should say that my last email didn't make it to the mailing list
archives because the attachment was too large. It seems that Hou was able
to receive it, though.
If anyone else wants to take a look at those logs I can forward them
directly, on request.
On Mon, Aug 18, 2025 at 9:51 PM Zhijie Hou (Fujitsu) <houzj(dot)fnst(at)fujitsu(dot)com>
wrote:
> > On Monday, August 18, 2025 4:12 PM Zane Duffield
> > <duffieldzane(at)gmail(dot)com> wrote:
> > > On Mon, Aug 11, 2025 at 9:28 PM Zhijie Hou (Fujitsu)
> > > <mailto:houzj(dot)fnst(at)fujitsu(dot)com> wrote:
> > > > Thank you for reporting the issue. I reviewed the logs and query
> > > > results but did not find any evidence of a suspicious strong lock.
> > > > Therefore, if possible, could you please query pg_lock and
> pg_stat_activity
> > separately?
> > > > This will allow us to determine whether there are any other wait
> > > > events, besides strong locks, that might be causing blocking.
> > >
> > > We tried reproducing the issue in a test environment and were not
> > > completely successful; we can reproduce the unusual spikes in
> > > replication lag (which correspond to restarts of the apply worker),
> > > but we cannot reproduce the stalled replication that we saw in
> production
> > once.
> > >
> > > I suspect that these issues are related, and that the stalling is
> > > simply a more severe case of the lagging, so I hope that the extra
> > > logs I have collected will help diagnose the problem. Attached is a
> > > tarball (~17MB, with file extension _tgz because gmail wouldn't let me
> > upload a .tgz) which contains a few files:
> > > 1. confirmed_flush_lsn_lag_graph_2025_08_09.png: a graph of the logical
> > > replication lag during the original incident, where replication
> falls behind
> > > and does not recover until we intervene and alter the subscription
> to
> > disable
> > > parallel apply
> > > 2. confirmed_flush_lsn_lag_graph_2025_08_13.png: the same graph, but
> > during an
> > > attempt to recreate the issue
> > > 3. server.log: the subscriber's postgres server log during the attempt
> to
> > > recreate the issue
> > > 4. pg_stat_activity.log: a log of a periodic query of all of
> pg_stat_activity
> > > during the attempt to recreate the issue 5. pg_locks.log: a log of
> > > a periodic query of all of pg_locks during the attempt to recreate the
> > > issue Please note that the graphs are in UTC, but the logs are in
> > > UTC+1. Also note that some information has been redacted (server
> > > names, database identifiers, IP addresses).
> > >
> > > Another thing worth noting is that in the first graph, the blue and
> > > yellow lines correspond to two other subscribers that were configured
> with
> > "streaming = off".
> > > You can clearly see that for the period where the green line
> > > ("streaming =
> > > parallel") is going up and down, the other subscribers have a
> > > practically flat line, only going up at the end before returning to
> zero.
> >
> > Thanks for sharing the logs!
> >
> > I noticed in the logs[1] that both the parallel apply worker and leader
> apply
> > worker are restarting at certain intervals, which could be the cause of
> the lag.
>
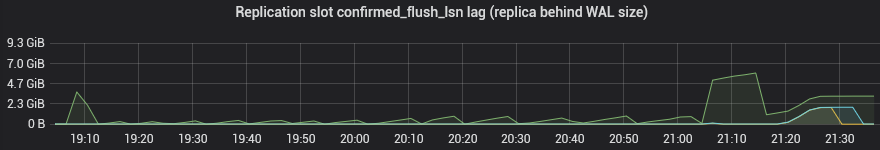
Yes, I think it is the cause of the lag (every peak lines up directly with
a restart of the apply workers), but I'm not sure how it relates to the
complete stall shown in confirmed_flush_lsn_lag_graph_2025_08_09.png
(attached again).
> > This might be due to a SIGINT triggered by a lock_timeout or
> statement_timeout,
> > although it's a bit weried that there are no timeout messages present in
> the logs.
> > If my assumption is correct, the behavior is understandable: the
> parallel apply
> > worker waits for the leader to send more data for the streamed
> transaction by
> > acquiring and waiting on a lock. However, the leader might be occupied
> with
> > other transactions, preventing it from sending additional data, which
> could
> > potentially lead to a lock timeout.
> >
> > To confirm this, could you please provide the values you have set for
> > lock_timeout, statement_timeout (on subscriber), and
> > logical_decoding_work_mem (on publisher) ?
>
lock_timeout = 30s
statement_timeout = 4h
logical_decoding_work_mem = 64MB
> >
> > Additionally, for testing purposes, is it possible to disable these
> timeouts (by
> > setting the lock_timeout and statement_timeout GUCs to their default
> values)
> > in your testing environment to assess whether the lag still persists?
> This
> > approach can help us determine whether the timeouts are causing the lag.
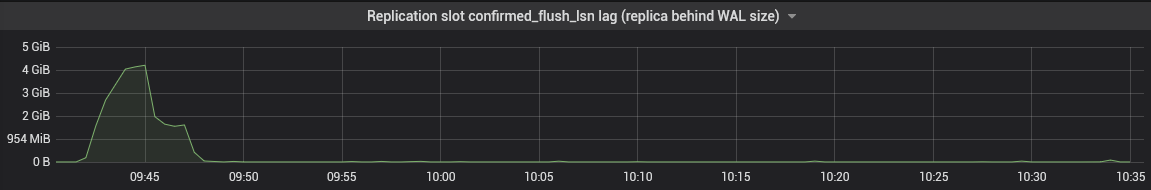
This was a good question. See the attached
confirmed_flush_lsn_lag_graph_2025_08_19.png.
After setting lock_timeout to zero, the periodic peaks of lag were
eliminated, and the restarts of the apply workers in the log are also
eliminated.
> > [1]---
> > Aug 13 03:22:36.259 [2242351]: [952-1] LOG: logical replication
> parallel apply
> > worker for subscription "sub1" has finished
> > ---
>
> By the way, if possible, could you share a script that can reproduce the
> same log? It will be very helpful for us to debug it.
>
I'm working on a script, but don't have anything that can reproduce the
complete stall of replication. What I have currently sometimes causes the
apply worker to restart (once), but it ultimately recovers.
Another thing I can provide is a better description of what was happening
on the primary at the time of this event.
1. connection opens
2. transaction starts
3. LOCK tab1 IN EXCLUSIVE MODE
4. DELETE FROM tab1
- pseudo truncate, which I know is much less efficient than a proper
TRUNCATE, especially with logical replication
5. CREATE/INSERT some temp tables
6. INSERT INTO tab1
7. DELETE FROM tab1 WHERE ...
8. INSERT INTO tab2 (single row)
9. COMMIT
This batch job essentially rewrites a single, reasonably large (5.5GB)
table from scratch with some complex logic in the middle.
There is definitely not any other transaction working on this table
concurrently, because it is locked for exclusive use at the start of the
transaction.
One other thing I wonder is whether autovacuum on the subscriber has
anything to do with the lock timeouts. I'm not sure whether this could
explain the perpetually-restarting apply workers that we witnessed on
2025-08-09, though.
I'll update here if I get any closer to a reproducer script.
Thanks,
Zane
| Attachment | Content-Type | Size |
|---|---|---|
|
image/png | 15.1 KB |
|
image/png | 19.4 KB |
In response to
- RE: Lock timeouts and unusual spikes in replication lag with logical parallel transaction streaming at 2025-08-18 11:51:45 from Zhijie Hou (Fujitsu)
Responses
- Re: Lock timeouts and unusual spikes in replication lag with logical parallel transaction streaming at 2025-08-21 04:26:26 from Amit Kapila
Browse pgsql-bugs by date
| From | Date | Subject | |
|---|---|---|---|
| Next Message | Zhu Yang | 2025-08-20 06:16:53 | The memory usage is positively correlated with the number of partition tables when pg_get_expr is called. |
| Previous Message | PG Bug reporting form | 2025-08-20 05:00:01 | BUG #19026: ResourceOwnerForget can't find owner for invalid plancache |