Re: WAL prefetch
| From: | Tomas Vondra <tomas(dot)vondra(at)2ndquadrant(dot)com> |
|---|---|
| To: | Konstantin Knizhnik <k(dot)knizhnik(at)postgrespro(dot)ru>, Andres Freund <andres(at)anarazel(dot)de> |
| Cc: | Robert Haas <robertmhaas(at)gmail(dot)com>, Thomas Munro <thomas(dot)munro(at)enterprisedb(dot)com>, PostgreSQL Hackers <pgsql-hackers(at)postgresql(dot)org>, Sean Chittenden <seanc(at)joyent(dot)com> |
| Subject: | Re: WAL prefetch |
| Date: | 2018-07-07 21:47:47 |
| Message-ID: | 39e22910-4604-3338-8320-741114c6c30e@2ndquadrant.com |
| Views: | Whole Thread | Raw Message | Download mbox | Resend email |
| Thread: | |
| Lists: | pgsql-hackers |
Hi,
I've done a bit of testing on the current patch, mostly to see how much
the prefetching can help (if at all). While the patch is still in early
WIP stages (at least that's my assessment, YMMV), the improvement are
already quite significant.
I've also planned to compare it to the pg_prefaulter [1] which kinda
started this all, but I've been unable to get it working with my very
limited knowledge of golang. I've fixed the simple stuff (references to
renamed PostgreSQL functions etc.) but then it does not do anything :-(
I wonder if it's working on FreeBSD only, or something like that ...
So this compares only master with and without WAL prefetching.
Instead of killing the server and measuring local recovery (which is
what Konstantin did before), I've decided to use replication. That is,
setup a replica, run pgbench on the master and see how much apply lag we
end up with over time. I find this much easier to reproduce, monitor
over time, do longer runs, ...
master
------
* 32 cores (2x E5-2620v4)
* 32GB of RAM
* Intel Optane SSD 280GB
* shared_buffers=4GB
* max_wal_size=128GB
* checkpoint_timeout=30min
replica
-------
* 4 cores (i5-2500k)
* 8GB RAM
* 6x Intel S3700 SSD (RAID0)
* shared_buffers=512MB
* effective_cache_size=256MB
I've also decided to use pgbench scale 1000 (~16GB) which fits into RAM
on the master but not the replica. This may seem like a bit strange
choice, but I think it's not entirely crazy, for a couple of reasons:
* It's not entirely uncommon to have replicas with different hardware
condiguration. For HA it's a bad idea, but there are valid use cases.
* Even with the same hardware config, you may have very different
workload on the replica, accessing very different subset of the data.
Consider master doing OLTP on small active set, while replica runs BI
queries on almost all data, pushing everything else from RAM.
* It amplifies the effect of prefetching, which is nice for testing.
* I don't have two machines with exactly the same config anyway ;-)
The pgbench test is then executed on master like this:
pgbench -c 32 -j 8 -T 3600 -l --aggregate-interval=1 test
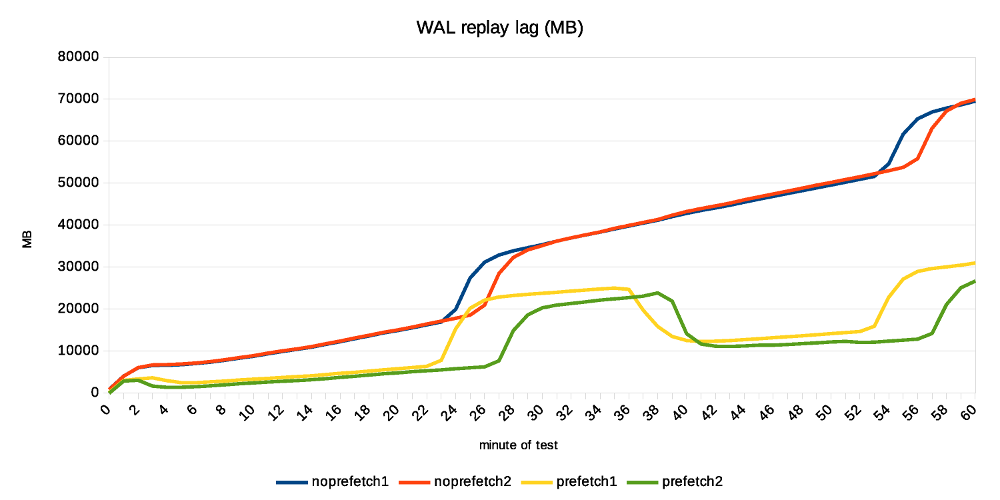
The replica is unlikely to keep up with the master, so the question is
how much apply lag we end up with at the end.
Without prefetching, it's ~70GB of WAL. With prefetching, it's only
about 30GB. Considering the 1-hour test generates about 90GB of WAL,
this means the replay speed grew from 20GB/h to almost 60GB/h. That's
rather measurable improvement ;-)
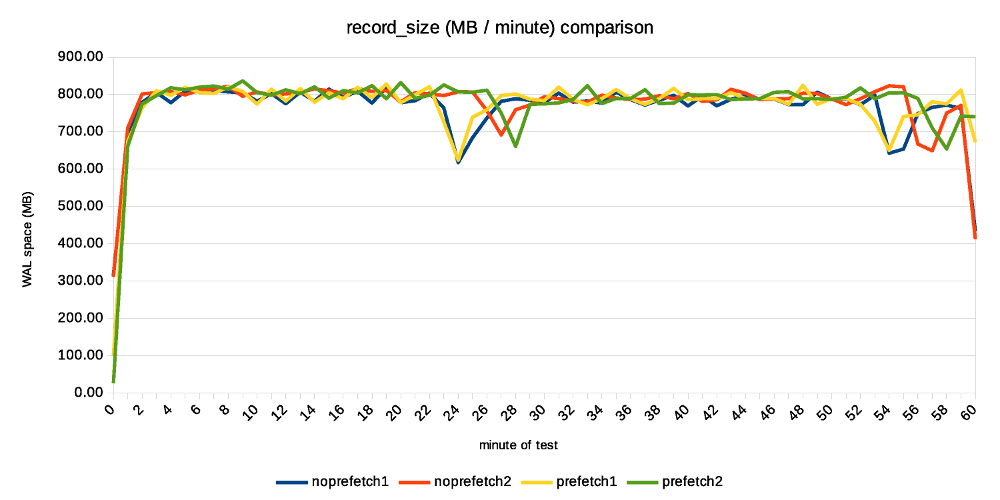
The attached replication-lag.png chart, showing how the lag grows over
time. The "bumps" after ~30 minutes coincide with a checkpoint,
triggering FPIs for a short while. The record-size.png and fpi-size.png
come from pg_waldump and show what part of WAL consists of regular
records and FPIs.
Note: I've done two runs with each configuration, so there are four data
series on all charts.
With prefetching the lag drops down a bit after a while (by about the
same amount of WAL), while without prefetch it does not. My explanation
is that the replay is so slow it does not get to the FPIs until after
the test - so it happens, but we don't see it here.
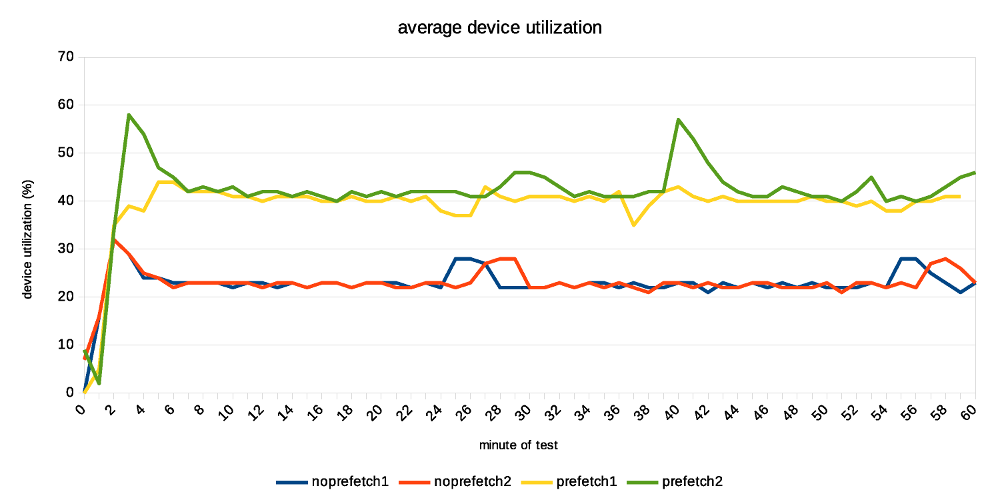
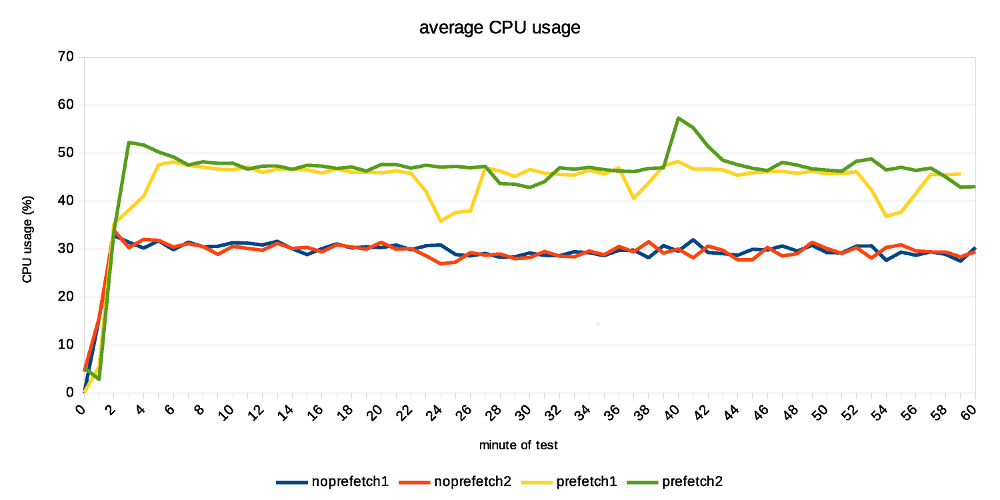
Now, how does this look on system metrics? Without prefetching we see
low CPU usage, because the process is waiting for I/O. And the I/O is
under-utilized, because we only issue one request at a time (which means
short I/O queues, low utilization of individual devices in the RAID).
In this case I see that without prefetching, the replay process uses
about 20% of a CPU. With prefetching increases this to ~60%, which is nice.
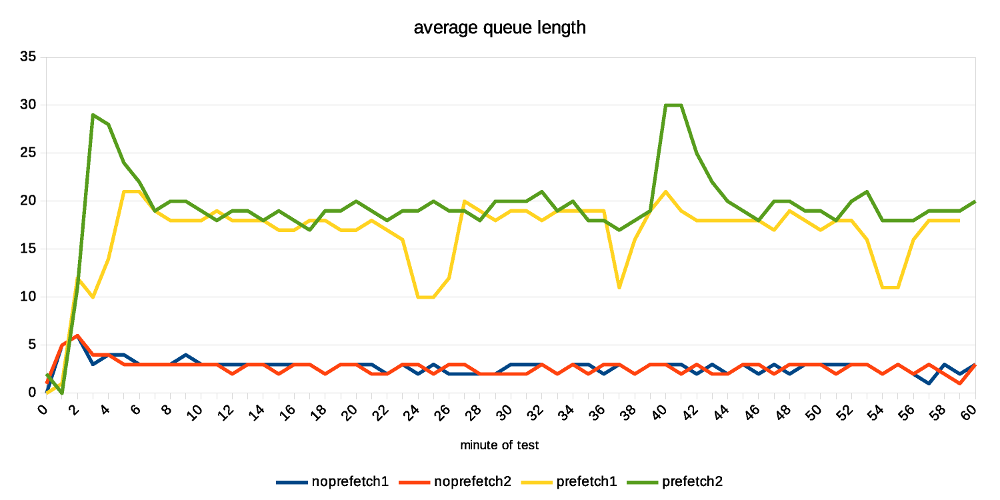
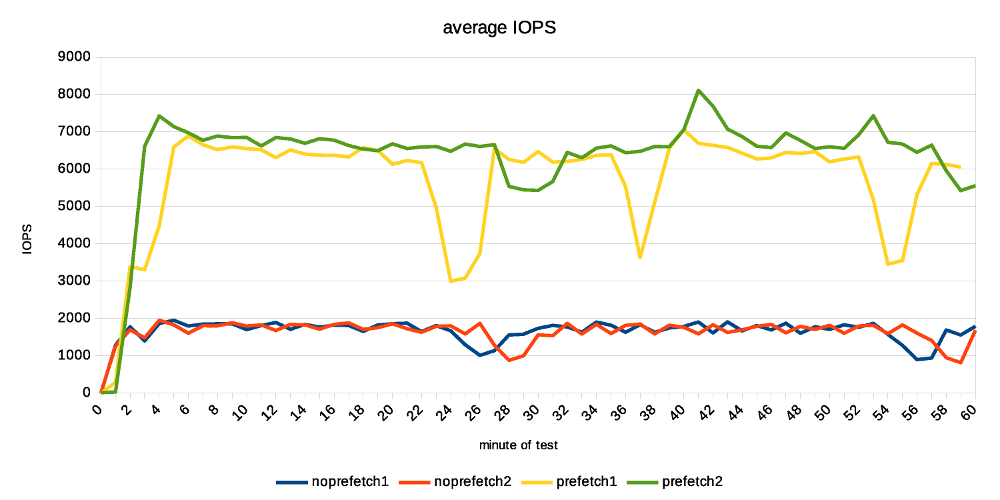
At the storage level, the utilization for each device in the RAID0 array
is ~20%, and with prefetching enabled this jumps up to ~40%. If you look
at IOPS instead, that jumps from ~2000 to ~6500, so about 3x. How is
this possible when the utilization grew only ~2x? We're generating
longer I/O queues (20 requests instead of 3), and the devices can
optimize it quite a bit.
I think there's a room for additional improvement. We probably can't get
the CPU usage to 100%, but 60% is still quite low. The storage can
certainly handle more requests, the devices are doing something only
about 40% of the time.
But overall it looks quite nice, and I think it's worth to keep working
on it.
BTW to make this work, I had to tweak NUM_AUXILIARY_PROCS (increase it
from 4 to 5), otherwise InitAuxiliaryProcess() fails because there's not
room for additional process. I assume it works with local recovery, but
once you need to start walreceiver it fails.
regards
--
Tomas Vondra http://www.2ndQuadrant.com
PostgreSQL Development, 24x7 Support, Remote DBA, Training & Services
| Attachment | Content-Type | Size |
|---|---|---|
| wal-record-size.png | image/png | 73.7 KB |
|
image/png | 58.8 KB |
| fpi-size.png | image/png | 83.5 KB |
|
image/png | 61.2 KB |
|
image/png | 63.8 KB |
| disk-iops.png | image/png | 77.4 KB |
|
image/png | 64.0 KB |
| prefetch.ods | application/vnd.oasis.opendocument.spreadsheet | 112.6 KB |
In response to
- Re: WAL prefetch at 2018-06-27 15:25:05 from Tomas Vondra
Responses
- Re: WAL prefetch at 2018-07-09 00:26:59 from Sean Chittenden
- Re: WAL prefetch at 2018-07-09 21:35:31 from Konstantin Knizhnik
Browse pgsql-hackers by date
| From | Date | Subject | |
|---|---|---|---|
| Next Message | Haribabu Kommi | 2018-07-08 02:48:19 | Re: New function pg_stat_statements_reset_query() to reset statistics of a specific query |
| Previous Message | Alexander Korotkov | 2018-07-07 21:15:09 | Re: [HACKERS] Bug in to_timestamp(). |