Re: Trouble with hashagg spill I/O pattern and costing
| From: | Tomas Vondra <tomas(dot)vondra(at)2ndquadrant(dot)com> |
|---|---|
| To: | Jeff Davis <pgsql(at)j-davis(dot)com> |
| Cc: | pgsql-hackers(at)postgresql(dot)org |
| Subject: | Re: Trouble with hashagg spill I/O pattern and costing |
| Date: | 2020-05-25 02:10:45 |
| Message-ID: | 20200525021045.dilgcsmgiu4l5jpa@development |
| Views: | Whole Thread | Raw Message | Download mbox | Resend email |
| Thread: | |
| Lists: | pgsql-hackers |
On Thu, May 21, 2020 at 11:41:22PM +0200, Tomas Vondra wrote:
>On Thu, May 21, 2020 at 02:16:37PM -0700, Jeff Davis wrote:
>>On Thu, 2020-05-21 at 21:13 +0200, Tomas Vondra wrote:
>>>2) We could make it self-tuning, by increasing the number of blocks
>>>we pre-allocate. So every time we exhaust the range, we double the
>>>number of blocks (with a reasonable maximum, like 1024 or so). Or we
>>>might just increment it by 32, or something.
>>
>>Attached a new version that uses the doubling behavior, and cleans it
>>up a bit. It also returns the unused prealloc blocks back to lts-
>>freeBlocks when the tape is rewound for reading.
>>
>
>Ah, the returning is a nice idea, that should limit the overhead quite a
>bit, I think.
>
>>>IIUC the danger of pre-allocating blocks is that we might not fill
>>>them,
>>>resulting in temp file much larger than necessary. It might be
>>>harmless
>>>on some (most?) current filesystems that don't actually allocate
>>>space
>>>for blocks that are never written, but it also confuses our
>>>accounting
>>>of temporary file sizes. So we should try to limit that, and growing
>>>the
>>>number of pre-allocated blocks over time seems reasonable.
>>
>>There's another danger here: it doesn't matter how well the filesystem
>>deals with sparse writes, because ltsWriteBlock fills in the holes with
>>zeros anyway. That's potentially a significant amount of wasted IO
>>effort if we aren't careful.
>>
>
>True. I'll give it a try on both machines and report some numbers. Might
>take a couple of days.
>
OK, so I do have some numbers to share. I think there's a clear
conclusion that the two patches are a huge improvement, but there's also
something fishy about planning of parallel queries.
Firstly, I have two machines that I used for testing:
1) small one: i5-2500k (4 cores), 8GB RAM, SSD RAID for data, SSD for
temporary tablespace, using TPC-H 32GB data set
2) big one: 2x xeon e5-2620v3 (8 cores), 64GB RAM, NVME SSD for data,
temporary tablespace on SATA RAID0 (3 x 7.2k), using TPC-H 75GB
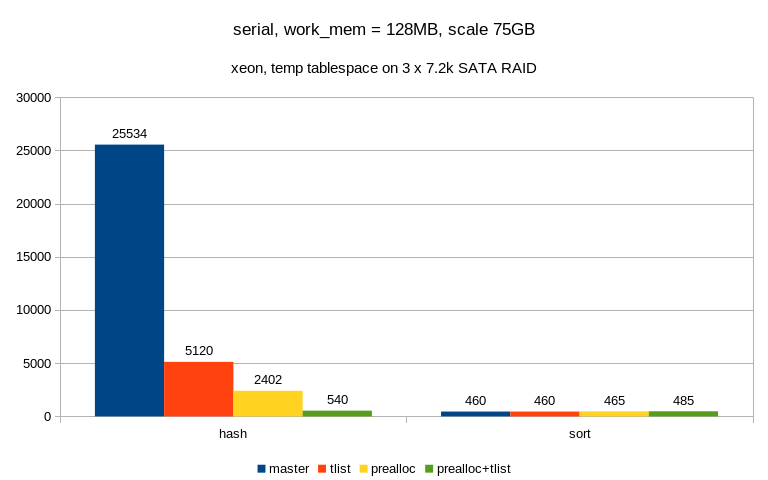
serial queries (no parallelism)
===============================
Results with parallel query disabled on the two machines look like this:
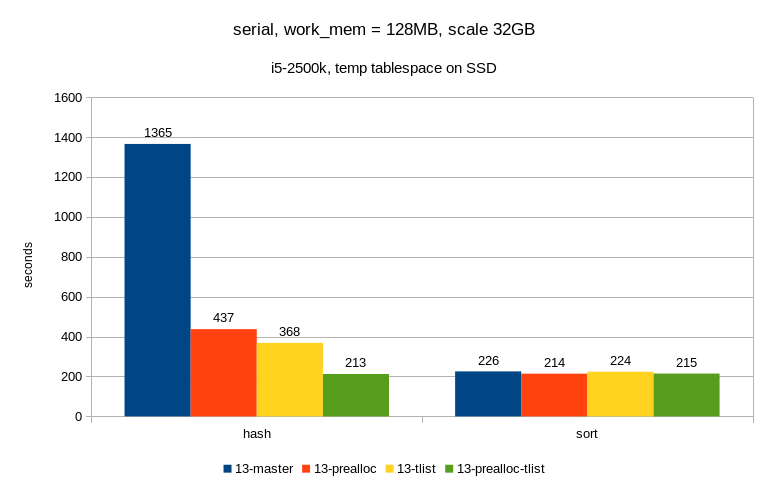
1) small one (SSD)
algorithm master prealloc tlist prealloc-tlist
--------------------------------------------------
hash 1365 437 368 213
sort 226 214 224 215
The sort row simply means "enable_hashagg = off" and AFAIK the patches
should not have a lot of influence here - the prealloc does, but it's
fairly negligible.
It's not always exactly on part, I've seen cases where hash or sort were
a bit faster (probably depending on work_mem), but I think we can ignore
that for now.
2) big one (SATA)
algorithm master tlist prealloc prealloc+tlist
--------------------------------------------------
hash 25534 5120 2402 540
sort 460 460 465 485
The effect is even more pronounced, thanks to poor handling of random
I/O by the SATA RAID device. It's not exactly on par with sort, but it's
close enough ...
parallel queries
================
And now the fun begins ...
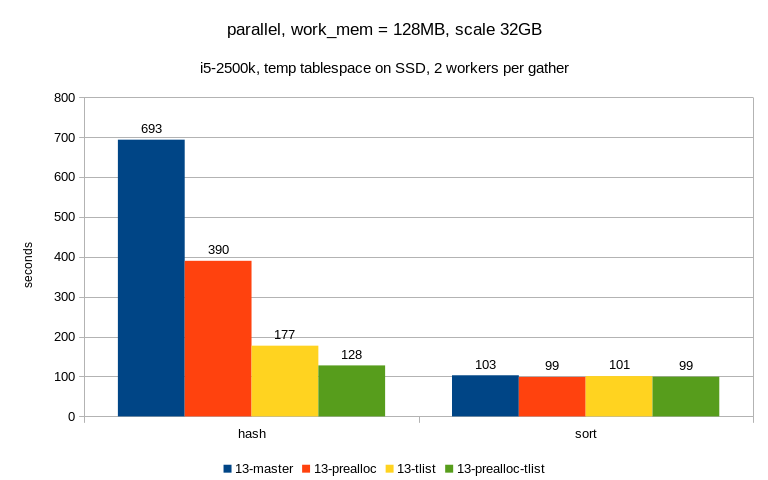
1) small one (SSD, max_parallel_workers_per_gather = 2)
algorithm master tlist prealloc prealloc+tlist
--------------------------------------------------
hash 693 390 177 128
sort 103 99 101 99
This looks pretty nice - the patches have the expected effect, it got
faster than with just a single CPU etc.
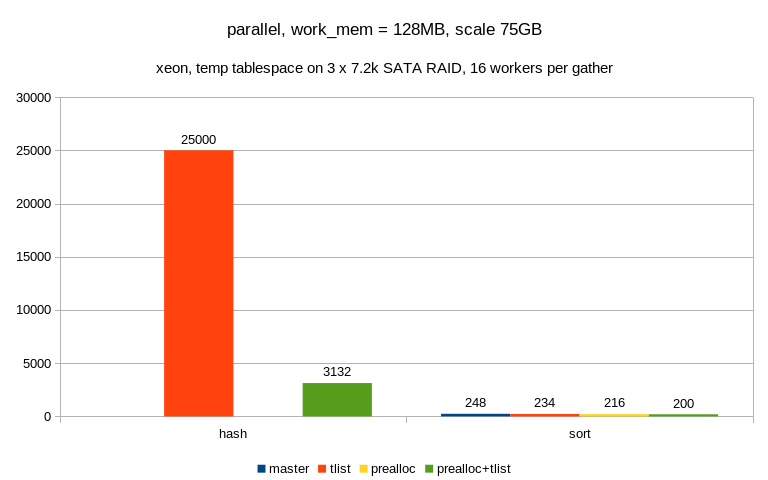
2) big one (SATA, max_parallel_workers_per_gather = 16)
algorithm master tlist prealloc prealloc+tlist
--------------------------------------------------
hash ? 25000 ? 3132
sort 248 234 216 200
Well, not that nice :-( The hash queries take so much time that I've
decided not to wait for them and the two numbers are actually just
estimates (after processing just a couple of logical tapes).
Plus it actually gets slower than with serial execution, so what's the
problem here? Especially considering it worked OK on the small machine?
At first I thought it's something about SSD vs. SATA, but it seems to be
more about how we construct the plans, because the plans between the two
machines are very different. And it seems to be depend by the number of
workers per gather - for low number of workers the plan looks like this
(the plans are attached in plans.txt in case the formatting gets broken
by your client):
QUERY PLAN
---------------------------------------------------------------------------------------------------------------
Limit
-> Aggregate
-> Hash Join
Hash Cond: (part.p_partkey = lineitem_1.l_partkey)
Join Filter: (lineitem.l_quantity < ((0.2 * avg(lineitem_1.l_quantity))))
-> Gather
Workers Planned: 2
-> Nested Loop
-> Parallel Seq Scan on part
Filter: ((p_brand = 'Brand#22'::bpchar) AND (p_container = 'LG BOX'::bpchar))
-> Index Scan using idx_lineitem_part_supp on lineitem
Index Cond: (l_partkey = part.p_partkey)
-> Hash
-> Finalize HashAggregate
Group Key: lineitem_1.l_partkey
-> Gather
Workers Planned: 2
-> Partial HashAggregate
Group Key: lineitem_1.l_partkey
-> Parallel Seq Scan on lineitem lineitem_1
(20 rows)
but then if I crank the number of workers up, it switches to this:
QUERY PLAN
---------------------------------------------------------------------------------------------------------------------
Limit
-> Finalize Aggregate
-> Gather
Workers Planned: 5
-> Partial Aggregate
-> Nested Loop
Join Filter: (part.p_partkey = lineitem.l_partkey)
-> Hash Join
Hash Cond: (part.p_partkey = lineitem_1.l_partkey)
-> Parallel Seq Scan on part
Filter: ((p_brand = 'Brand#22'::bpchar) AND (p_container = 'LG BOX'::bpchar))
-> Hash
-> HashAggregate
Group Key: lineitem_1.l_partkey
-> Seq Scan on lineitem lineitem_1
-> Index Scan using idx_lineitem_part_supp on lineitem
Index Cond: (l_partkey = lineitem_1.l_partkey)
Filter: (l_quantity < ((0.2 * avg(lineitem_1.l_quantity))))
(18 rows)
Notice that in the first plan, the hashagg is on top of parallel-aware
path - so each workers builds hashagg only on a subset of data, and also
spills only a fraction of the input rows (so that all workers combined
spill rouhly the "whole" table).
In the second plan, the hashagg is on the non-partitioned side of the
join, so each workers builds a hash aggregate on the *whole* set of
input rows. Which means that (a) we need much more disk space for temp
files, making it unlikely to fit into page cache and (b) there's a lot
of contention for I/O, making it much more random.
Now, I haven't seen the second plan with sort-based aggregation, no
matter how I set the number of workers it always looks like this:
QUERY PLAN
---------------------------------------------------------------------------------------------------------------------
Limit
-> Aggregate
-> Merge Join
Merge Cond: (lineitem_1.l_partkey = part.p_partkey)
Join Filter: (lineitem.l_quantity < ((0.2 * avg(lineitem_1.l_quantity))))
-> Finalize GroupAggregate
Group Key: lineitem_1.l_partkey
-> Gather Merge
Workers Planned: 8
-> Partial GroupAggregate
Group Key: lineitem_1.l_partkey
-> Sort
Sort Key: lineitem_1.l_partkey
-> Parallel Seq Scan on lineitem lineitem_1
-> Materialize
-> Gather Merge
Workers Planned: 6
-> Nested Loop
-> Parallel Index Scan using part_pkey on part
Filter: ((p_brand = 'Brand#22'::bpchar) AND (p_container = 'LG BOX'::bpchar))
-> Index Scan using idx_lineitem_part_supp on lineitem
Index Cond: (l_partkey = part.p_partkey)
(22 rows)
How come we don't have the same issue here? Is there something in the
optimizer that prevents us from creating the "silly" plans with
groupagg, and we should do the same thing for hashagg?
regards
--
Tomas Vondra http://www.2ndQuadrant.com
PostgreSQL Development, 24x7 Support, Remote DBA, Training & Services
| Attachment | Content-Type | Size |
|---|---|---|
| plans.txt | text/plain | 9.9 KB |
|
image/png | 19.8 KB |
|
image/png | 19.5 KB |
|
image/png | 21.4 KB |
|
image/png | 21.0 KB |
In response to
- Re: Trouble with hashagg spill I/O pattern and costing at 2020-05-21 21:41:22 from Tomas Vondra
Responses
- Re: Trouble with hashagg spill I/O pattern and costing at 2020-05-25 12:17:22 from Tomas Vondra
- Re: Trouble with hashagg spill I/O pattern and costing at 2020-05-25 18:36:42 from Jeff Davis
Browse pgsql-hackers by date
| From | Date | Subject | |
|---|---|---|---|
| Next Message | Kyotaro Horiguchi | 2020-05-25 02:17:06 | Re: WAL reader APIs and WAL segment open/close callbacks |
| Previous Message | Ian Barwick | 2020-05-25 02:03:01 | pg13 docs: minor fix for "System views" list |