Trouble with hashagg spill I/O pattern and costing
| From: | Tomas Vondra <tomas(dot)vondra(at)2ndquadrant(dot)com> |
|---|---|
| To: | pgsql-hackers(at)postgresql(dot)org |
| Cc: | Jeff Davis <pgsql(at)j-davis(dot)com> |
| Subject: | Trouble with hashagg spill I/O pattern and costing |
| Date: | 2020-05-19 15:12:02 |
| Message-ID: | 20200519151202.u2p2gpiawoaznsv2@development |
| Views: | Whole Thread | Raw Message | Download mbox | Resend email |
| Thread: | |
| Lists: | pgsql-hackers |
Hi,
I've been running some TPC-H benchmarks on master, to check if there's
something unexpected, and I ran into some annoying issues with Q17 and
Q20. I'll use Q17 as it's a bit simpler.
I think there are two related problem - with costing and with excessive
I/O due to using logical tapes.
Let's talk about the costing first. On 75GB scale (with disabled parallel
query), the execution plan looks like this:
QUERY PLAN
---------------------------------------------------------------------------------------------------------------
Limit (cost=16997740.10..16997740.12 rows=1 width=32)
-> Aggregate (cost=16997740.10..16997740.12 rows=1 width=32)
-> Nested Loop (cost=14204895.82..16997574.11 rows=66397 width=8)
Join Filter: (part.p_partkey = lineitem.l_partkey)
-> Hash Join (cost=14204895.25..16251060.84 rows=6640 width=40)
Hash Cond: (lineitem_1.l_partkey = part.p_partkey)
-> HashAggregate (cost=13977751.34..15945557.39 rows=6206695 width=36)
Group Key: lineitem_1.l_partkey
Planned Partitions: 128
-> Seq Scan on lineitem lineitem_1 (cost=0.00..5519079.56 rows=191969856 width=9)
-> Hash (cost=227058.33..227058.33 rows=6846 width=4)
-> Seq Scan on part (cost=0.00..227058.33 rows=6846 width=4)
Filter: ((p_brand = 'Brand#22'::bpchar) AND (p_container = 'LG BOX'::bpchar))
-> Index Scan using idx_lineitem_part_supp on lineitem (cost=0.57..112.30 rows=10 width=17)
Index Cond: (l_partkey = lineitem_1.l_partkey)
Filter: (l_quantity < ((0.2 * avg(lineitem_1.l_quantity))))
(16 rows)
and if I disale hash aggregate (or spill to disk), it changes to this:
QUERY PLAN
-------------------------------------------------------------------------------------------------------------------------
Limit (cost=44577524.39..44577524.40 rows=1 width=32)
-> Aggregate (cost=44577524.39..44577524.40 rows=1 width=32)
-> Merge Join (cost=41772792.17..44577358.39 rows=66397 width=8)
Merge Cond: (lineitem_1.l_partkey = part.p_partkey)
Join Filter: (lineitem.l_quantity < ((0.2 * avg(lineitem_1.l_quantity))))
-> GroupAggregate (cost=41772791.17..43305665.51 rows=6206695 width=36)
Group Key: lineitem_1.l_partkey
-> Sort (cost=41772791.17..42252715.81 rows=191969856 width=9)
Sort Key: lineitem_1.l_partkey
-> Seq Scan on lineitem lineitem_1 (cost=0.00..5519079.56 rows=191969856 width=9)
-> Materialize (cost=1.00..1191105.89 rows=205371 width=21)
-> Nested Loop (cost=1.00..1190592.46 rows=205371 width=21)
-> Index Scan using part_pkey on part (cost=0.43..329262.21 rows=6846 width=4)
Filter: ((p_brand = 'Brand#22'::bpchar) AND (p_container = 'LG BOX'::bpchar))
-> Index Scan using idx_lineitem_part_supp on lineitem (cost=0.57..125.51 rows=31 width=17)
Index Cond: (l_partkey = part.p_partkey)
(16 rows)
The problem is that the hashagg plan runs in ~1400 seconds, while the
groupagg only takes ~360. And per explain analyze, the difference really
is in the aggregation - if we subtract the seqscan, the sort+groupagg
takes about 310s:
-> GroupAggregate (cost=41772791.17..43305665.51 rows=6206695 width=36) (actual time=283378.004..335611.192 rows=6398981 loops=1)
Group Key: lineitem_1.l_partkey
-> Sort (cost=41772791.17..42252715.81 rows=191969856 width=9) (actual time=283377.977..306182.393 rows=191969841 loops=1)
Sort Key: lineitem_1.l_partkey
Sort Method: external merge Disk: 3569544kB
-> Seq Scan on lineitem lineitem_1 (cost=0.00..5519079.56 rows=191969856 width=9) (actual time=0.019..28253.076 rows=192000551 loops=1)
while the hashagg takes ~1330s:
-> HashAggregate (cost=13977751.34..15945557.39 rows=6206695 width=36) (actual time=202952.170..1354546.897 rows=6400000 loops=1)
Group Key: lineitem_1.l_partkey
Planned Partitions: 128
Peak Memory Usage: 4249 kB
Disk Usage: 26321840 kB
HashAgg Batches: 16512
-> Seq Scan on lineitem lineitem_1 (cost=0.00..5519079.56 rows=191969856 width=9) (actual time=0.007..22205.617 rows=192000551 loops=1)
And that's while only writing 26GB, compared to 35GB in the sorted plan,
and with cost being ~16M vs. ~43M (so roughly inverse).
OK, let's make the hashagg plan more expensive - that'll fix it, right?.
But how do you do that? I might lower the work_mem, say from 4MB to 1MB,
which gets us from ~16M
-> HashAggregate (cost=13977751.34..15945557.39 rows=6206695 width=36)
Group Key: lineitem_1.l_partkey
Planned Partitions: 128
-> Seq Scan on lineitem lineitem_1 (cost=0.00..5519079.56 rows=191969856 width=9)
to ~20M (I'm a bit surprised that the planned partitions dropped 4x, but
I suspect there's an explanation for that).
-> HashAggregate (cost=17727162.59..20632321.45 rows=6206695 width=36)
Group Key: lineitem_1.l_partkey
Planned Partitions: 32
-> Seq Scan on lineitem lineitem_1 (cost=0.00..5519079.56 rows=191969856 width=9)
Anyway, this did not really solve anything, apparently. The cost is
still much lower than for groupagg, and moreover I don't want to lower
work_mem - I want to increase cost for a given work_mem value. And it
also increases the sort cost estimate, of course.
As I'll show in a minute, I believe most of this is due to I/O pattern
for the logical tapes, which is very different between sort and hashagg.
So it'd be natural to consider seq_page_cost/random_page_cost on the
temp tablespace, but that's not how it works - we just ignore that :-(
Why do I think this is due to a difference in I/O pattern on the logical
tape set? I've moved the temporary tablespace to a separate SSD device,
and used iosnoop [1] to collect all I/O requests associated with this
query. Attached are four charts showing blocks (sectors) accessed over
time, both for the groupagg and hashagg plans.
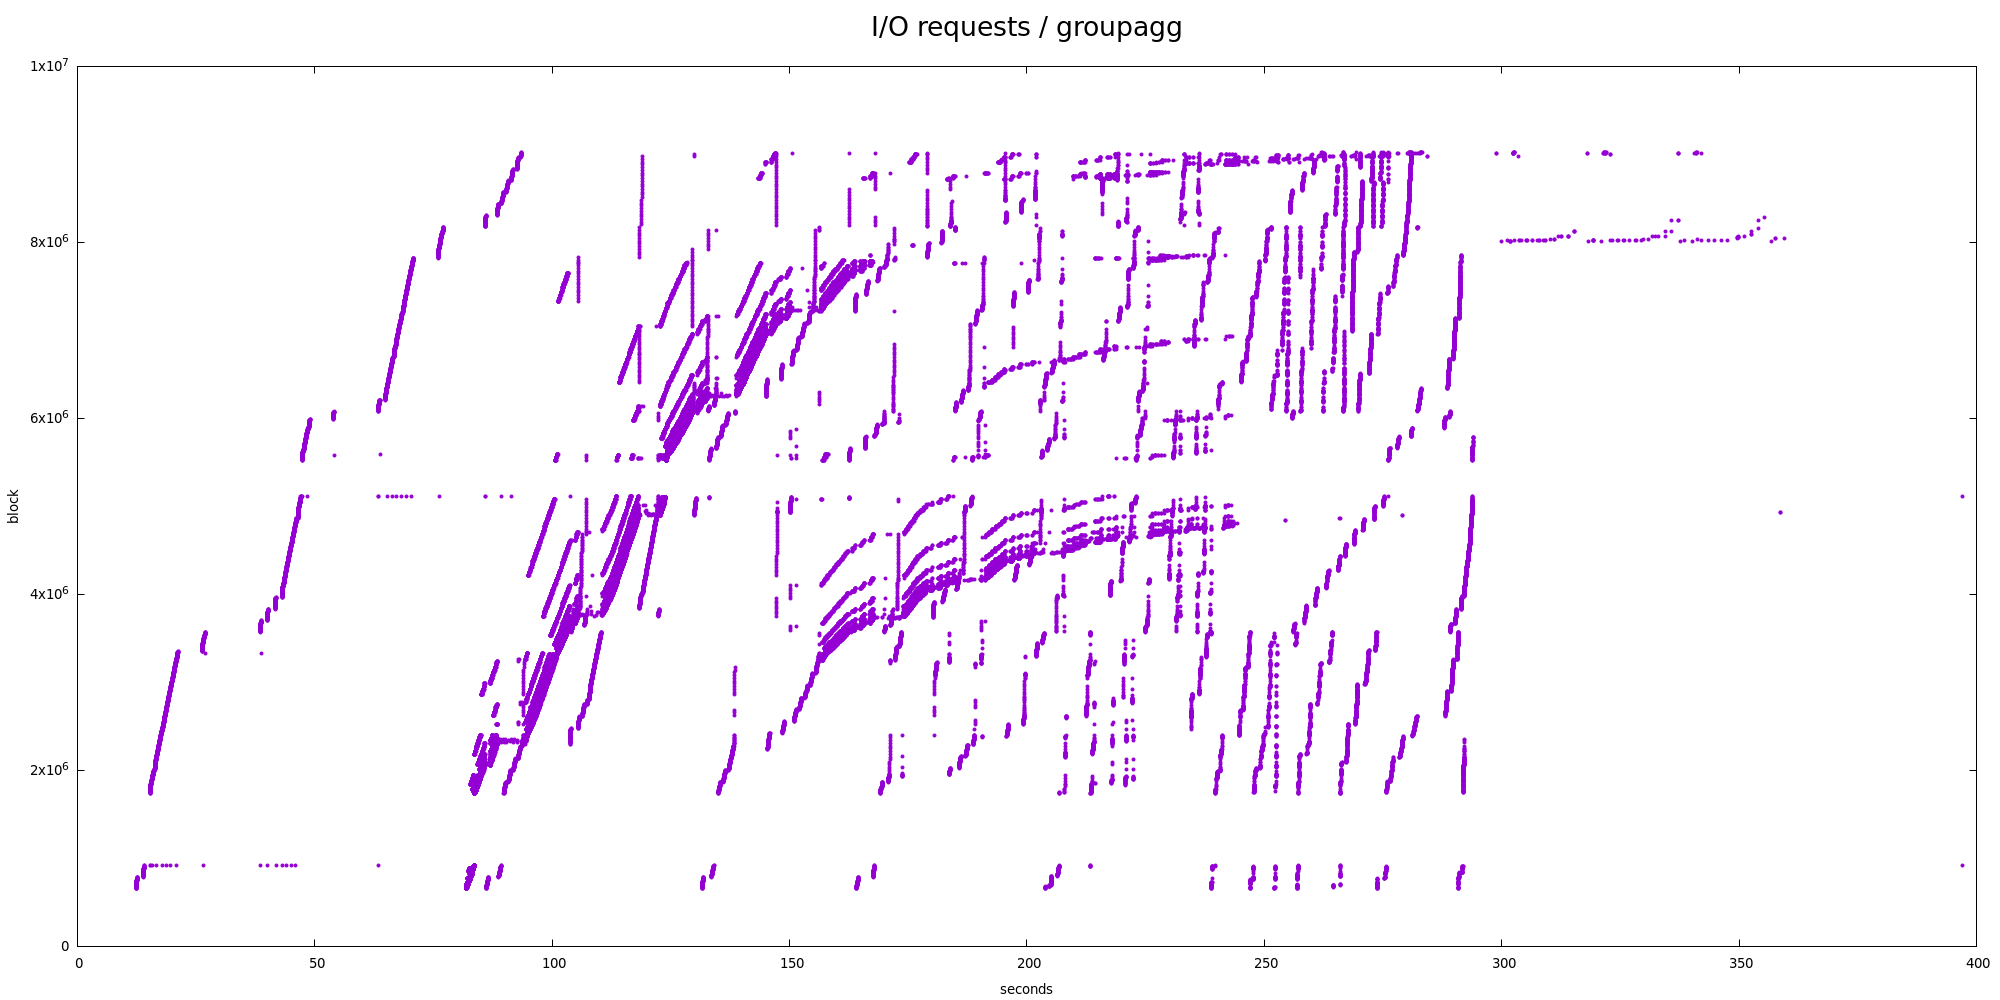
1) sort + groupagg
For groupagg (tempio-sort.png) the chart looks a bit chaotic, but it's
reasonable - it shows the sort does merges, etc. Nothing particularly
surprising, IMHO.
It's also interesting to look at statistics of block sizes, and deltas
of the blocks, for different request types. Showing the most common
block sizes look something like this (the last column is percentage
of all requests with the same request type):
type | bytes | count | pct
------+---------+-------+-------
RA | 131072 | 26034 | 59.92
RA | 16384 | 6160 | 14.18
RA | 8192 | 3636 | 8.37
RA | 32768 | 3406 | 7.84
RA | 65536 | 3270 | 7.53
RA | 24576 | 361 | 0.83
...
W | 1310720 | 8070 | 34.26
W | 262144 | 1213 | 5.15
W | 524288 | 1056 | 4.48
W | 1056768 | 689 | 2.93
W | 786432 | 292 | 1.24
W | 802816 | 199 | 0.84
...
The writes are buffered and so are done by kworkers, which seem to be
able to coalesce them into fairly large chunks (e.g. 34% are 1280kB).
The reads come from the postgres backend, and generally are 128kB reads.
The deltas (in 512B sectors) are mostly consistent with this:
type | block_delta | count | pct
------+-------------+-------+-------
RA | 256 | 13432 | 30.91
RA | 16 | 3291 | 7.57
RA | 32 | 3272 | 7.53
RA | 64 | 3266 | 7.52
RA | 128 | 2877 | 6.62
RA | 1808 | 1278 | 2.94
RA | -2320 | 483 | 1.11
RA | 28928 | 386 | 0.89
...
W | 2560 | 7856 | 33.35
W | 2064 | 4921 | 20.89
W | 2080 | 586 | 2.49
W | 30960 | 300 | 1.27
W | 2160 | 253 | 1.07
W | 1024 | 248 | 1.05
...
I believe this suggests most of the I/O is pretty sequential. E.g. 31%
of the reads are 256 sectors (128kB) apart, which is proportional to the
128kB reads.
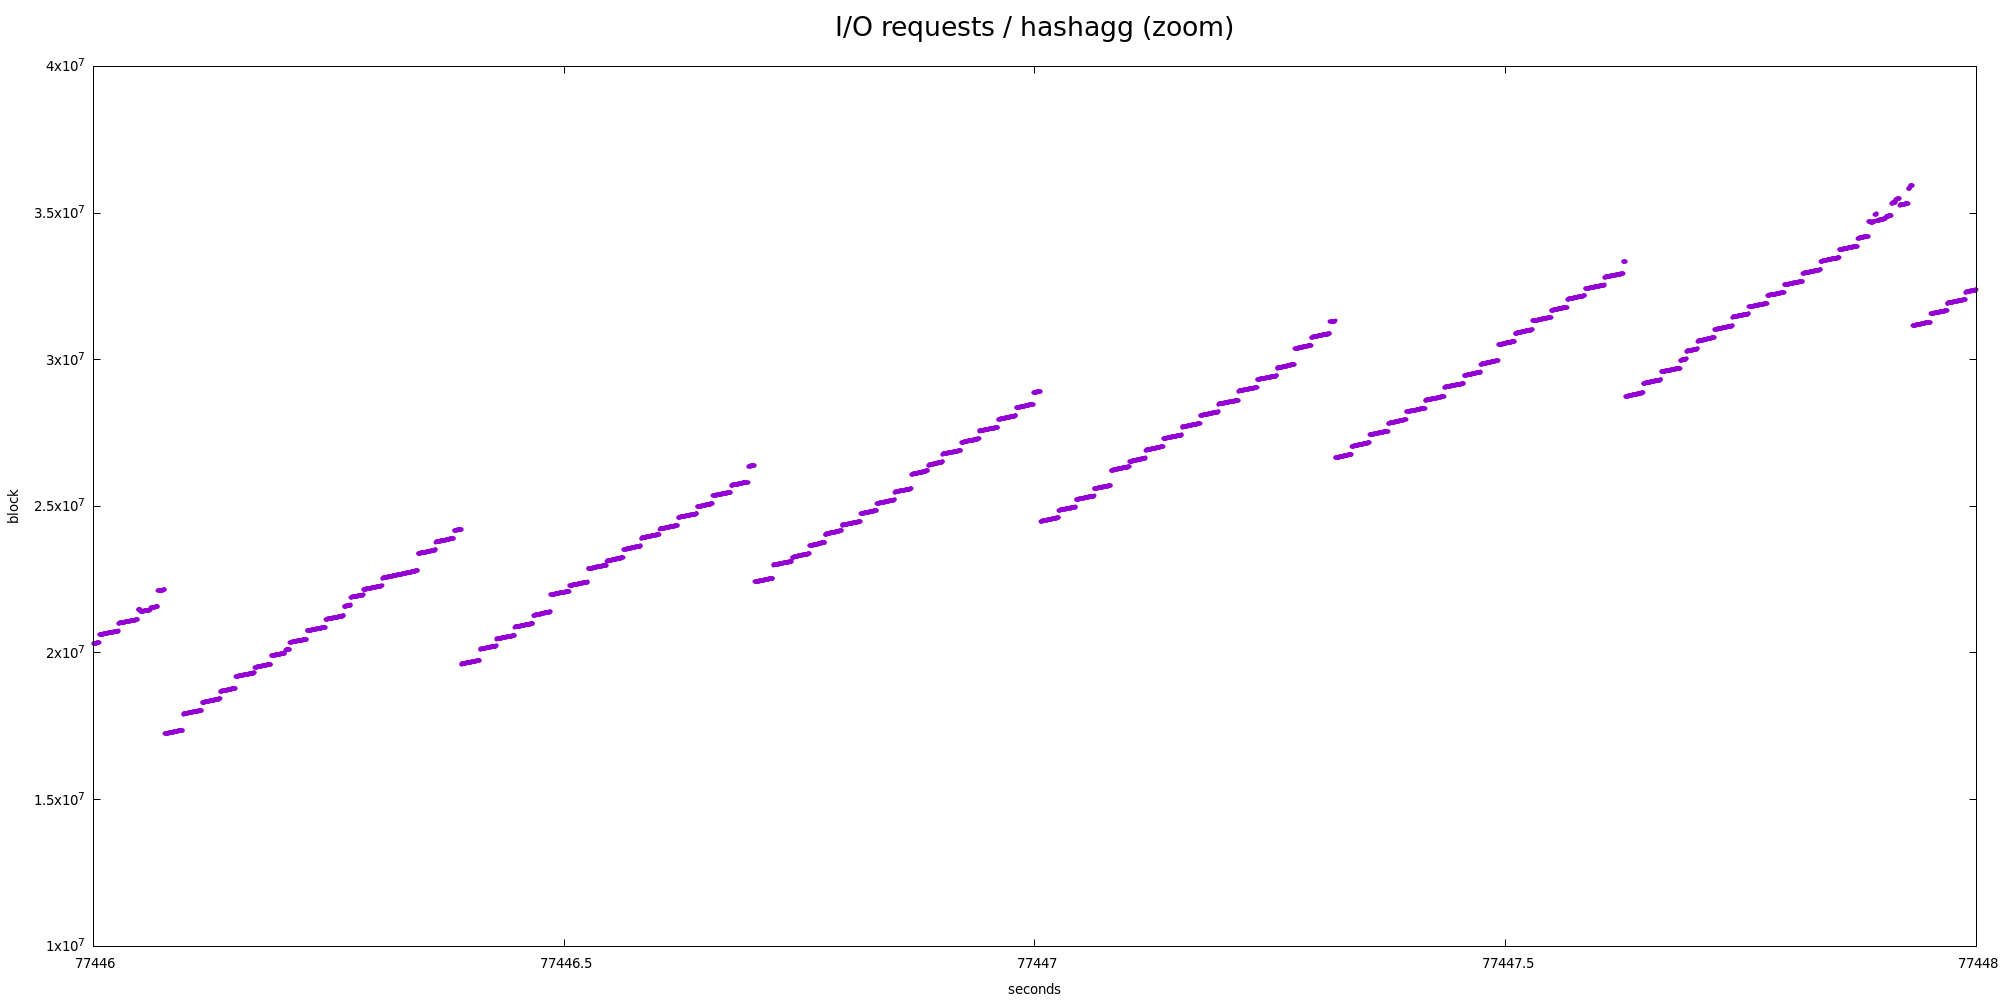
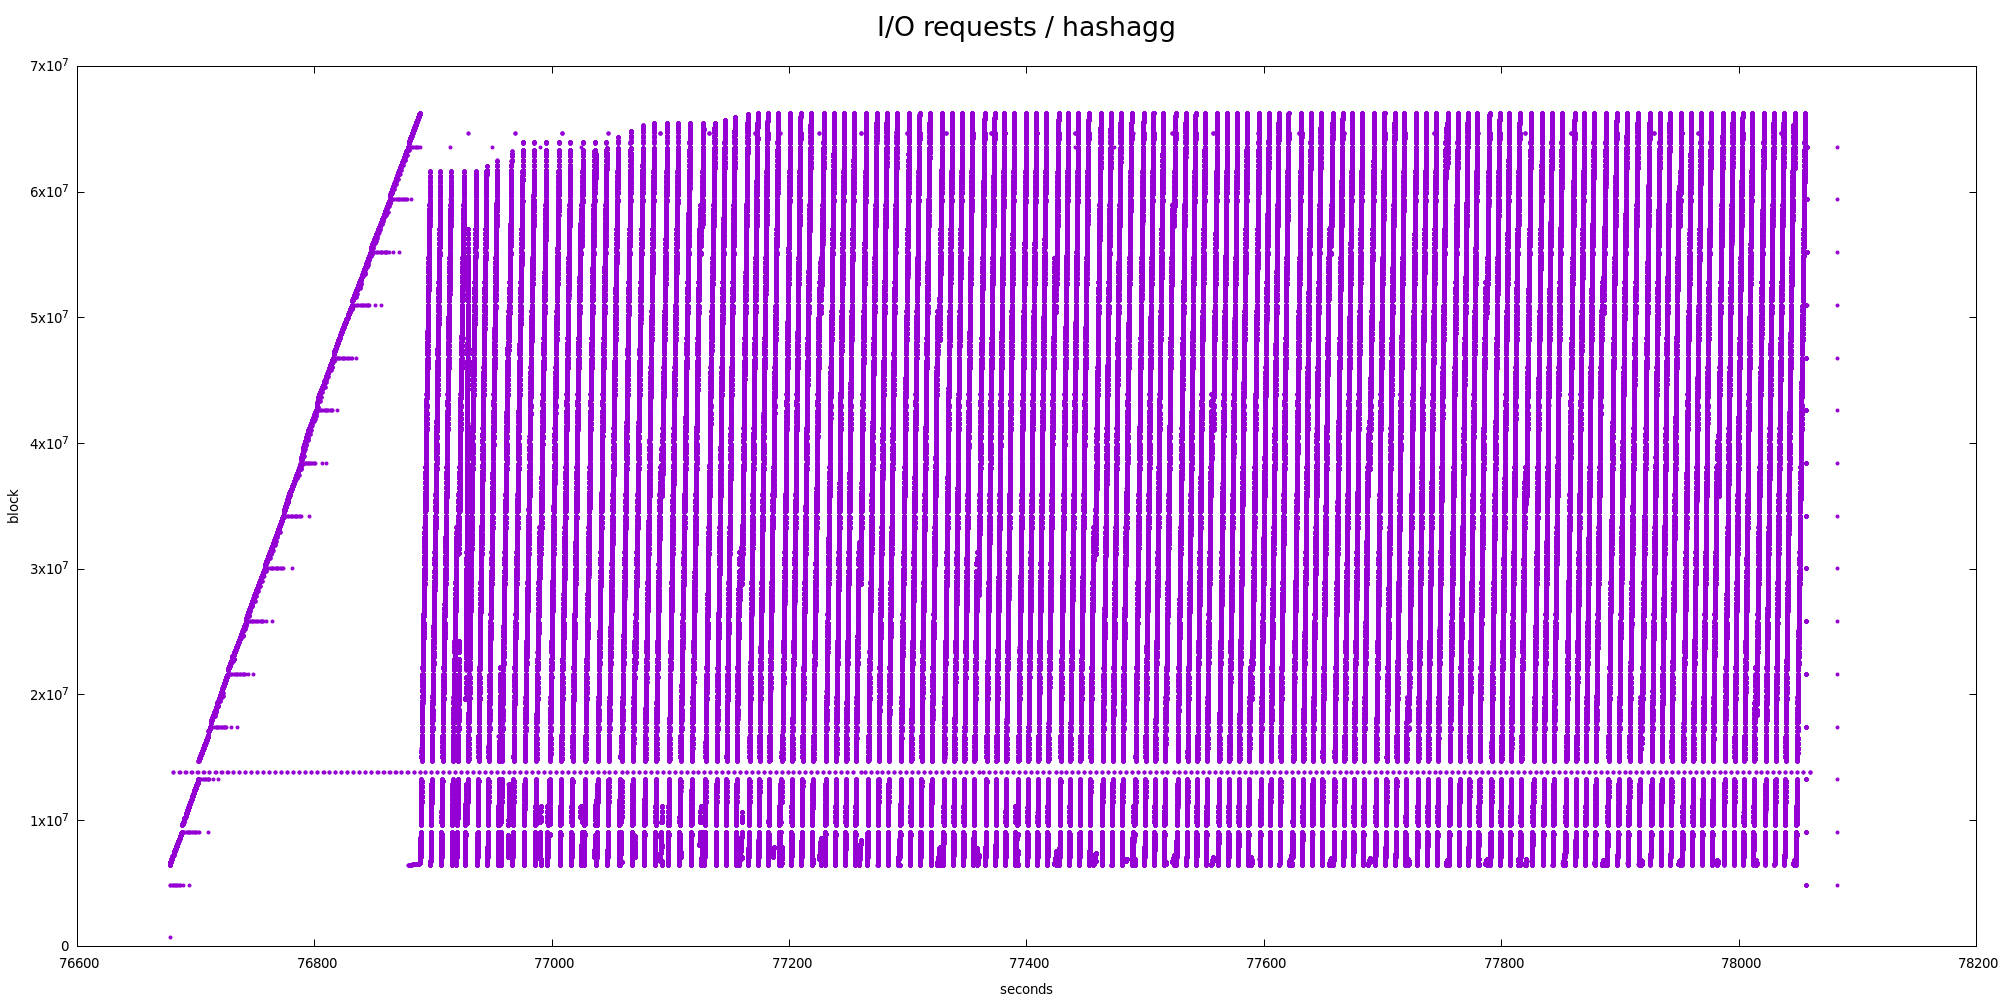
2) hashagg
The I/O pattern is illustrated by the tempion-hash.png chart, and it's
clearly very different from the sort one. We're reading over and over
in a zig-zag way. I'm pretty sure there are ~128 cycles matching the
number of partitions in the explain analyze output, which end up being
interleaved in the temporary file.
But even at the partition level this is not very very sequential - there
are two "zoom" charts showing smaller parts in more detail, and there's
very obvious nested zig-zag pattern.
Also, let's look at the block / delta stats:
type | bytes | count | pct
------+---------+---------+--------
RA | 8192 | 3087724 | 95.42
RA | 24576 | 69511 | 2.15
RA | 16384 | 49297 | 1.52
RA | 32768 | 15589 | 0.48
...
W | 8192 | 321089 | 65.72
W | 16384 | 74097 | 15.17
W | 24576 | 27785 | 5.69
W | 1310720 | 16860 | 3.45
W | 32768 | 13823 | 2.83
W | 40960 | 7771 | 1.59
W | 49152 | 4767 | 0.98
...
Well, that's not great - we're not really coalescing writes or reads,
everything is pretty much 8kB block. Especially the writes are somewhat
surprising/concerning, because it shows the kernel is unable to combine
the requests etc.
The deltas look very different too:
type | block_delta | count | pct
------+-------------+-------+-------
RA | 2016 | 72399 | 2.24
RA | 2032 | 72351 | 2.24
RA | 1984 | 72183 | 2.23
RA | 2000 | 71964 | 2.22
RA | 2048 | 71718 | 2.22
RA | 2064 | 71387 | 2.21
RA | 1968 | 71363 | 2.21
RA | 1952 | 70412 | 2.18
RA | 2080 | 70189 | 2.17
RA | 2096 | 69568 | 2.15
RA | 1936 | 69109 | 2.14
RA | 1920 | 67660 | 2.09
RA | 2112 | 67248 | 2.08
RA | 1904 | 66026 | 2.04
...
There's no clear winner matching the block size, or anything. In fact,
it does oscillate around 2000 sectors, i.e. 1MB. And 128 partitions
multiplied by 8kB block per partition is ... 1MB (tadaaaa!).
This however makes any read-ahead attempts ineffective :-(
And let me repeat - this is on a machine with temp tablespace moved to
an SSD, so the random I/O is not entirely terrible. On a different box
with temp tablespace on 3x SATA RAID, the impact is much worse.
This kinda makes me question whether logical tapes are the right tool
for hashagg. I've read the explanation in logtape.c why it's about the
same amount of I/O as using separate files, but IMO that only really
works for I/O patters similar to merge sort - the more I think about
this, the more I'm convinced we should just do what hashjoin is doing.
But maybe I'm wrong, and logical tapes are the best thing we can do
here. But in that case I think we need to improve the costing, so that
it reflects the very different I/O pattern.
[1] https://github.com/brendangregg/perf-tools/blob/master/iosnoop
--
Tomas Vondra http://www.2ndQuadrant.com
PostgreSQL Development, 24x7 Support, Remote DBA, Training & Services
| Attachment | Content-Type | Size |
|---|---|---|
| tempio-sort.png | image/png | 158.0 KB |
| tempio-hash.png | image/png | 158.8 KB |
|
image/png | 46.7 KB |

|
image/png | 30.7 KB |
| plans.txt | text/plain | 4.8 KB |
Responses
- Re: Trouble with hashagg spill I/O pattern and costing at 2020-05-19 16:27:34 from Jeff Davis
- Re: Trouble with hashagg spill I/O pattern and costing at 2020-05-21 13:41:22 from Tomas Vondra
Browse pgsql-hackers by date
| From | Date | Subject | |
|---|---|---|---|
| Next Message | Tom Lane | 2020-05-19 15:32:10 | Re: factorial function/phase out postfix operators? |
| Previous Message | Daniel Gustafsson | 2020-05-19 15:11:53 | Re: Extension ownership and misuse of SET ROLE/SET SESSION AUTHORIZATION |