Re: [HACKERS] WAL logging problem in 9.4.3?
| From: | Kyotaro Horiguchi <horikyota(dot)ntt(at)gmail(dot)com> |
|---|---|
| To: | noah(at)leadboat(dot)com |
| Cc: | robertmhaas(at)gmail(dot)com, pgsql-hackers(at)postgresql(dot)org, 9erthalion6(at)gmail(dot)com, andrew(dot)dunstan(at)2ndquadrant(dot)com, hlinnaka(at)iki(dot)fi, michael(at)paquier(dot)xyz |
| Subject: | Re: [HACKERS] WAL logging problem in 9.4.3? |
| Date: | 2019-11-28 12:35:08 |
| Message-ID: | 20191128.213508.1108483203561250557.horikyota.ntt@gmail.com |
| Views: | Whole Thread | Raw Message | Download mbox | Resend email |
| Thread: | |
| Lists: | pgsql-hackers |
I measured the performance with the latest patch set.
> 1. Determine $DDL_COUNT, a number of DDL transactions that take about one
> minute when done via syncs.
> 2. Start "pgbench -rP1 --progress-timestamp -T180 -c10 -j10".
> 3. Wait 10s.
> 4. Start one DDL backend that runs $DDL_COUNT transactions.
> 5. Save DDL start timestamp, DDL end timestamp, and pgbench output.
I did the following benchmarking.
1. Initialize bench database
$ pgbench -i -s 20
2. Start server with wal_level = replica (all other variables are not
changed) then run the attached ./bench.sh
$ ./bench.sh <count> <pages> <mode>
where count is the number of repetition, pages is the number of pages
to write in a run, and mode is "s" (sync) or "w"(WAL). The <mode>
doesn't affect if wal_level = replica. The script shows the following
result.
| before: tps 240.2, lat 44.087 ms (29 samples)
| during: tps 109.1, lat 114.887 ms (14 samples)
| after : tps 269.9, lat 39.557 ms (107 samples)
| DDL time = 13965 ms
| # transaction type: <builtin: TPC-B (sort of)>
before: mean numbers before "the DDL" starts.
during: mean numbers while "the DDL" is running.
after : mean numbers after "the DDL" ends.
DDL time: the time took to run "the DDL".
3. Restart server with wal_level = replica then run the bench.sh
twice.
$ ./bench.sh <count> <pages> s
$ ./bench.sh <count> <pages> w
Finally I got three graphs. (attached 1, 2, 3. PNGs)
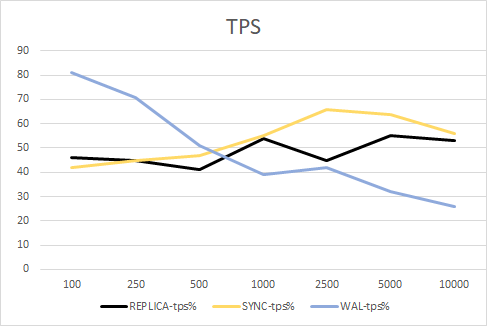
* Graph 1 - The affect of the DDL on pgbench's TPS
The virtical axis means "during TPS" / "before TPS" in %. Larger is
better. The horizontal axis means the table pages size.
Replica and Minimal-sync are almost flat. Minimal-WAL getting worse
as table size increases. 500 pages seems to be the crosspoint.
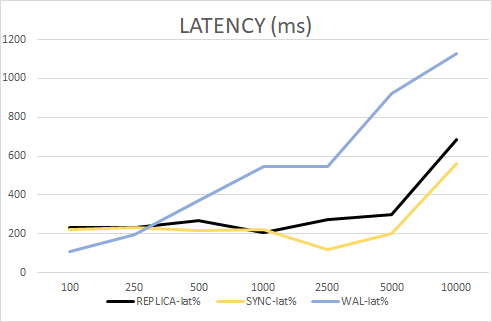
* Graph 2 - The affect of the DDL on pgbench's latency.
The virtical axis means "during-letency" / "before-latency" in
%. Smaller is better. Like TPS but more quickly WAL-latency gets
worse as table size increases. The crosspoint seems to be 300 pages
or so.
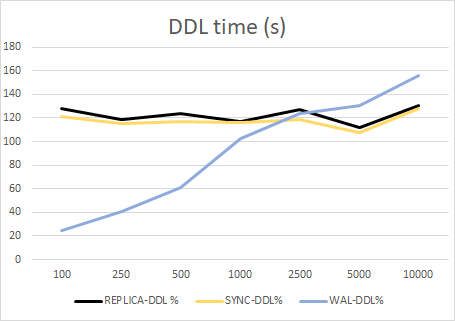
* Graph 3 - The affect of pgbench's work load on DDL runtime.
The virtical axis means "time the DDL takes to run with pgbench" /
"time the DDL to run solely". Smaller is better. Replica and
Minimal-SYNC shows similar tendency. On Minimal-WAL the DDL runs
quite fast with small tables. The crosspoint seems to be about 2500
pages.
Seeing this, I became to be worry that the optimization might give far
smaller advantage than expected. Putting aside that, it seems to me
that the default value for the threshold would be 500-1000, same as
the previous benchmark showed.
regards.
--
Kyotaro Horiguchi
NTT Open Source Software Center
| Attachment | Content-Type | Size |
|---|---|---|
|
image/png | 8.5 KB |
|
image/png | 11.7 KB |
|
image/png | 8.9 KB |
In response to
- Re: [HACKERS] WAL logging problem in 9.4.3? at 2019-11-28 11:56:20 from Kyotaro Horiguchi
Responses
- Re: [HACKERS] WAL logging problem in 9.4.3? at 2019-11-28 22:23:19 from Noah Misch
Browse pgsql-hackers by date
| From | Date | Subject | |
|---|---|---|---|
| Next Message | Kyotaro Horiguchi | 2019-11-28 12:37:03 | Re: Remove page-read callback from XLogReaderState. |
| Previous Message | Kyotaro Horiguchi | 2019-11-28 11:56:20 | Re: [HACKERS] WAL logging problem in 9.4.3? |