Re: Documentation and explanatory diagrams
| From: | Bruce Momjian <bruce(at)momjian(dot)us> |
|---|---|
| To: | Alvaro Herrera <alvherre(at)commandprompt(dot)com> |
| Cc: | Rafael Martinez <r(dot)m(dot)guerrero(at)usit(dot)uio(dot)no>, Robert Haas <robertmhaas(at)gmail(dot)com>, pgsql-docs <pgsql-docs(at)postgresql(dot)org> |
| Subject: | Re: Documentation and explanatory diagrams |
| Date: | 2010-07-10 02:46:26 |
| Message-ID: | 201007100246.o6A2kQ811156@momjian.us |
| Views: | Whole Thread | Raw Message | Download mbox | Resend email |
| Thread: | |
| Lists: | pgsql-docs |
Alvaro Herrera wrote:
> Excerpts from Bruce Momjian's message of vie jul 09 20:01:55 -0400 2010:
>
> > Where are we on this? Application? dia? xfig? Number of colors? Once
> > we decide these items, we can start adding diagrams.
>
> I think the first step is defining the source format. The proposed
> patch uses the dia XML source format, but this is said to have some
> drawbacks (namely: the source is too verbose, the generated png is too
> bloated, and only one tool to handle it). SVG was also proposed as an
> alternative, but there wasn't much discussion about it. And finally we
> have xfig.
>
> So what is it?
>
> Maybe we could have diagrams generated by different tools; e.g. we could
> use GraphViz for some things.
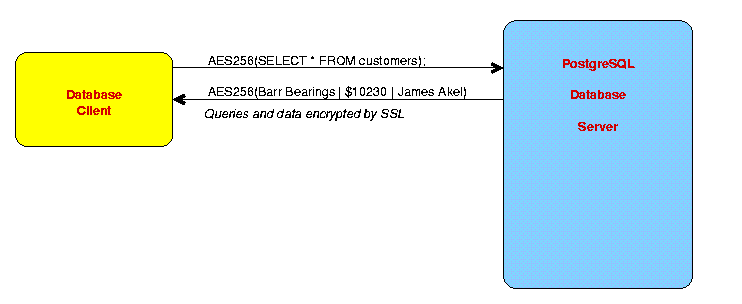
OK, all the images on my presentations page are from xfig, and the
representative file sizes are as below:
1092 query_ssl.fig
4370 query_ssl.png
PNG image attached.
What I like about xfig is that I can export EPS and embed those in PDF
files as _raster_ images. Not sure we can use those in our PDFs though.
I assume Dia has more image style options than xfig.
--
Bruce Momjian <bruce(at)momjian(dot)us> http://momjian.us
EnterpriseDB http://enterprisedb.com
+ None of us is going to be here forever. +
| Attachment | Content-Type | Size |
|---|---|---|
|
image/png | 3.6 KB |
In response to
- Re: Documentation and explanatory diagrams at 2010-07-10 02:29:42 from Alvaro Herrera
Responses
- Re: Documentation and explanatory diagrams at 2010-07-10 03:35:06 from Robert Haas
Browse pgsql-docs by date
| From | Date | Subject | |
|---|---|---|---|
| Next Message | Tom Lane | 2010-07-10 03:19:11 | Re: Problem building 9.0 Beta 3 US PDF file |
| Previous Message | Alvaro Herrera | 2010-07-10 02:29:42 | Re: Documentation and explanatory diagrams |