Re: Improving spin-lock implementation on ARM.
| From: | Tom Lane <tgl(at)sss(dot)pgh(dot)pa(dot)us> |
|---|---|
| To: | Alexander Korotkov <aekorotkov(at)gmail(dot)com> |
| Cc: | Krunal Bauskar <krunalbauskar(at)gmail(dot)com>, Peter Eisentraut <peter(dot)eisentraut(at)enterprisedb(dot)com>, Michael Paquier <michael(at)paquier(dot)xyz>, pgsql-hackers <pgsql-hackers(at)postgresql(dot)org> |
| Subject: | Re: Improving spin-lock implementation on ARM. |
| Date: | 2020-12-01 06:01:20 |
| Message-ID: | 1367116.1606802480@sss.pgh.pa.us |
| Views: | Whole Thread | Raw Message | Download mbox | Resend email |
| Thread: | |
| Lists: | pgsql-hackers |
Alexander Korotkov <aekorotkov(at)gmail(dot)com> writes:
> 2) None of the patches considered in this thread give a clear
> advantage for PostgreSQL built with LSE.
Yeah, I think so.
> To further confirm this let's wait for Kunpeng 920 tests by Krunal
> Bauskar and Amit Khandekar. Also it would be nice if someone will run
> benchmarks similar to [1] on Apple M1.
I did what I could in this department. It's late and I'm not going to
have time to run read/write benchmarks before bed, but here are some
results for the "pgbench -S" cases. I tried to match your testing
choices, but could not entirely:
* Configure options are --enable-debug, --disable-cassert, no other
special configure options or CFLAG choices.
* I have not been able to find a way to make Apple's compiler not
use the LSE spinlock instructions, so all of these correspond to
your LSE cases.
* I used shared_buffers = 1GB, because this machine only has 16GB
RAM so 32GB is clearly out of reach. Also I used pgbench scale
factor 100 not 1000. Since we're trying to measure contention
effects not I/O speed, I don't think a huge test case is appropriate.
* I still haven't gotten pgbench to work with -j settings above 128,
so these runs use -j equal to half -c. Shouldn't really affect
conclusions about scaling. (BTW, I see a similar limitation on
macOS Catalina x86_64, so whatever that is, it's not new.)
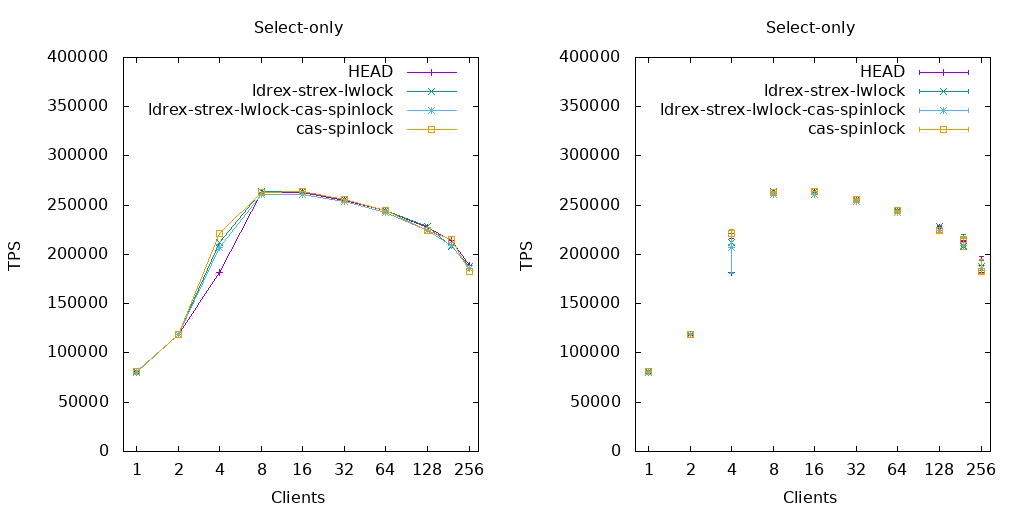
* Otherwise, the first plot shows median of three results from
"pgbench -S -M prepared -T 120 -c $n -j $j", as you had it.
The right-hand plot shows all three of the values in yerrorbars
format, just to give a sense of the noise level.
Clearly, there is something weird going on at -c 4. There's a cluster
of results around 180K TPS, and another cluster around 210-220K TPS,
and nothing in between. I suspect that the scheduler is doing
something bogus with sometimes putting pgbench onto the slow cores.
Anyway, I believe that the apparent gap between HEAD and the other
curves at -c 4 is probably an artifact: HEAD had two 180K-ish results
and one 220K-ish result, while the other curves had the reverse, so
the medians are different but there's probably not any non-chance
effect there.
Bottom line is that these patches don't appear to do much of
anything on M1, as you surmised.
regards, tom lane
| Attachment | Content-Type | Size |
|---|---|---|
|
image/png | 10.3 KB |
In response to
- Re: Improving spin-lock implementation on ARM. at 2020-11-30 20:46:44 from Alexander Korotkov
Responses
- Re: Improving spin-lock implementation on ARM. at 2020-12-01 09:48:12 from Alexander Korotkov
Browse pgsql-hackers by date
| From | Date | Subject | |
|---|---|---|---|
| Next Message | Michael Paquier | 2020-12-01 06:01:33 | Re: BUG #16663: DROP INDEX did not free up disk space: idle connection hold file marked as deleted |
| Previous Message | Michael Paquier | 2020-12-01 05:58:44 | Re: TAP test utility module 'PG_LSN.pm' |