Re: Searching for the cause of a bad plan
| From: | Csaba Nagy <nagy(at)ecircle-ag(dot)com> |
|---|---|
| To: | postgres performance list <pgsql-performance(at)postgresql(dot)org> |
| Cc: | Simon Riggs <simon(at)2ndquadrant(dot)com> |
| Subject: | Re: Searching for the cause of a bad plan |
| Date: | 2007-09-27 11:53:24 |
| Message-ID: | 1190894004.5430.46.camel@PCD12478 |
| Views: | Whole Thread | Raw Message | Download mbox | Resend email |
| Thread: | |
| Lists: | pgsql-performance |
On Wed, 2007-09-26 at 11:22 -0400, Tom Lane wrote:
> ... how
> many values of "a" are there really, and what's the true distribution of
> counts?
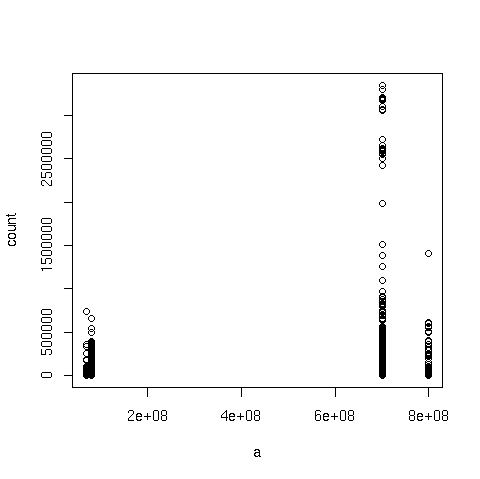
table_a has 23366 distinct values. Some statistics (using R):
> summary(table_a_histogram)
a count
Min. : 70000857 Min. : 1
1st Qu.:700003628 1st Qu.: 9
Median :700011044 Median : 22
Mean :622429573 Mean : 17640
3rd Qu.:700018020 3rd Qu.: 391
Max. :800003349 Max. :3347707
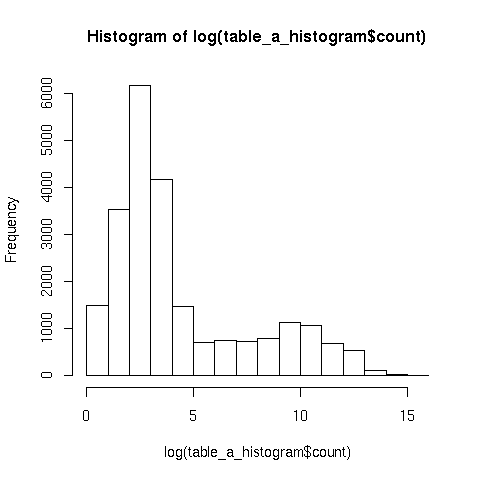
I'm not sure what you want to see in terms of distribution of counts, so
I created 2 plots: "a" against the counts for each distinct "a" value,
and the histogram of the log of the counts (without the log it's not
really readable). I hope they'll make it through to the list...
> Do the plan estimates get closer to reality if you set a higher
> statistics target?
The results of setting higher statistics targets are attached too. I
can't tell if the stats are closer to reality or not, but the plan
changes in any case...
Cheers,
Csaba.
| Attachment | Content-Type | Size |
|---|---|---|
|
image/png | 2.4 KB |
|
image/png | 3.0 KB |
| bumped_stats.txt | text/plain | 13.4 KB |
In response to
- Re: Searching for the cause of a bad plan at 2007-09-26 15:22:17 from Tom Lane
Responses
- Re: Searching for the cause of a bad plan at 2007-09-27 14:40:25 from Tom Lane
Browse pgsql-performance by date
| From | Date | Subject | |
|---|---|---|---|
| Next Message | Heikki Linnakangas | 2007-09-27 12:39:07 | Re: Difference in query plan when using = or > in where clause |
| Previous Message | Ow Mun Heng | 2007-09-27 06:59:13 | Re: REPOST: Nested loops row estimates always too high |