Re: Speed up Clog Access by increasing CLOG buffers
| From: | Tomas Vondra <tomas(dot)vondra(at)2ndquadrant(dot)com> |
|---|---|
| To: | Amit Kapila <amit(dot)kapila16(at)gmail(dot)com> |
| Cc: | Robert Haas <robertmhaas(at)gmail(dot)com>, Dilip Kumar <dilipbalaut(at)gmail(dot)com>, Andres Freund <andres(at)anarazel(dot)de>, pgsql-hackers <pgsql-hackers(at)postgresql(dot)org> |
| Subject: | Re: Speed up Clog Access by increasing CLOG buffers |
| Date: | 2016-09-26 17:16:31 |
| Message-ID: | f9a8572b-5f27-6666-0f44-e845480d989e@2ndquadrant.com |
| Views: | Whole Thread | Raw Message | Download mbox | Resend email |
| Thread: | |
| Lists: | pgsql-hackers |
On 09/24/2016 08:28 PM, Tomas Vondra wrote:
> On 09/24/2016 06:06 AM, Amit Kapila wrote:
>> On Fri, Sep 23, 2016 at 8:22 PM, Tomas Vondra
>> <tomas(dot)vondra(at)2ndquadrant(dot)com> wrote:
>>> ...
>>>
>>> So I'm using 16GB shared buffers (so with scale 300 everything fits into
>>> shared buffers), min_wal_size=16GB, max_wal_size=128GB, checkpoint
>>> timeout
>>> 1h etc. So no, there are no checkpoints during the 5-minute runs,
>>> only those
>>> triggered explicitly before each run.
>>>
>>
>> Thanks for clarification. Do you think we should try some different
>> settings *_flush_after parameters as those can help in reducing spikes
>> in writes?
>>
>
> I don't see why that settings would matter. The tests are on unlogged
> tables, so there's almost no WAL traffic and checkpoints (triggered
> explicitly before each run) look like this:
>
> checkpoint complete: wrote 17 buffers (0.0%); 0 transaction log file(s)
> added, 0 removed, 13 recycled; write=0.062 s, sync=0.006 s, total=0.092
> s; sync files=10, longest=0.004 s, average=0.000 s; distance=309223 kB,
> estimate=363742 kB
>
> So I don't see how tuning the flushing would change anything, as we're
> not doing any writes.
>
> Moreover, the machine has a bunch of SSD drives (16 or 24, I don't
> remember at the moment), behind a RAID controller with 2GB of write
> cache on it.
>
>>>> Also, I think instead of 5 mins, read-write runs should be run for 15
>>>> mins to get consistent data.
>>>
>>>
>>> Where does the inconsistency come from?
>>
>> Thats what I am also curious to know.
>>
>>> Lack of warmup?
>>
>> Can't say, but at least we should try to rule out the possibilities.
>> I think one way to rule out is to do slightly longer runs for
>> Dilip's test cases and for pgbench we might need to drop and
>> re-create database after each reading.
>>
>
> My point is that it's unlikely to be due to insufficient warmup, because
> the inconsistencies appear randomly - generally you get a bunch of slow
> runs, one significantly faster one, then slow ones again.
>
> I believe the runs to be sufficiently long. I don't see why recreating
> the database would be useful - the whole point is to get the database
> and shared buffers into a stable state, and then do measurements on it.
>
> I don't think bloat is a major factor here - I'm collecting some
> additional statistics during this run, including pg_database_size, and I
> can see the size oscillates between 4.8GB and 5.4GB. That's pretty
> negligible, I believe.
>
> I'll let the current set of benchmarks complete - it's running on 4.5.5
> now, I'll do tests on 3.2.80 too.
>
> Then we can re-evaluate if longer runs are needed.
>
>>> Considering how uniform the results from the 10 runs are (at least
>>> on 4.5.5), I claim this is not an issue.
>>>
>>
>> It is quite possible that it is some kernel regression which might
>> be fixed in later version. Like we are doing most tests in cthulhu
>> which has 3.10 version of kernel and we generally get consistent
>> results. I am not sure if later version of kernel say 4.5.5 is a net
>> win, because there is a considerable difference (dip) of performance
>> in that version, though it produces quite stable results.
>>
>
> Well, the thing is - the 4.5.5 behavior is much nicer in general. I'll
> always prefer lower but more consistent performance (in most cases). In
> any case, we're stuck with whatever kernel version the people are using,
> and they're likely to use the newer ones.
>
So, I have the pgbench results from 3.2.80 and 4.5.5, and in general I
think it matches the previous results rather exactly, so it wasn't just
a fluke before.
The full results, including systat data and various database statistics
(pg_stat_* sampled every second) are available here:
https://bitbucket.org/tvondra/group-clog-kernels
Attached are the per-run results. The averages (over the 10 runs, 5
minute each) look like this:
3.2.80 1 8 16 32 64 128 192
--------------------------------------------------------------------
granular-locking 1567 12146 26341 44188 43263 49590 15042
no-content-lock 1567 12180 25549 43787 43675 51800 16831
group-update 1550 12018 26121 44451 42734 51455 15504
master 1566 12057 25457 42299 42513 42562 10462
4.5.5 1 8 16 32 64 128 192
--------------------------------------------------------------------
granular-locking 3018 19031 27394 29222 32032 34249 36191
no-content-lock 2988 18871 27384 29260 32120 34456 36216
group-update 2960 18848 26870 29025 32078 34259 35900
master 2984 18917 26430 29065 32119 33924 35897
That is:
(1) The 3.2.80 performs a bit better than before, particularly for 128
and 256 clients - I'm not sure if it's thanks to the reboots or so.
(2) 4.5.5 performs measurably worse for >= 32 clients (by ~30%). That's
a pretty significant regression, on a fairly common workload.
(3) The patches somewhat help on 3.2.80, with 128 clients or more.
(4) There's no measurable improvement on 4.5.5.
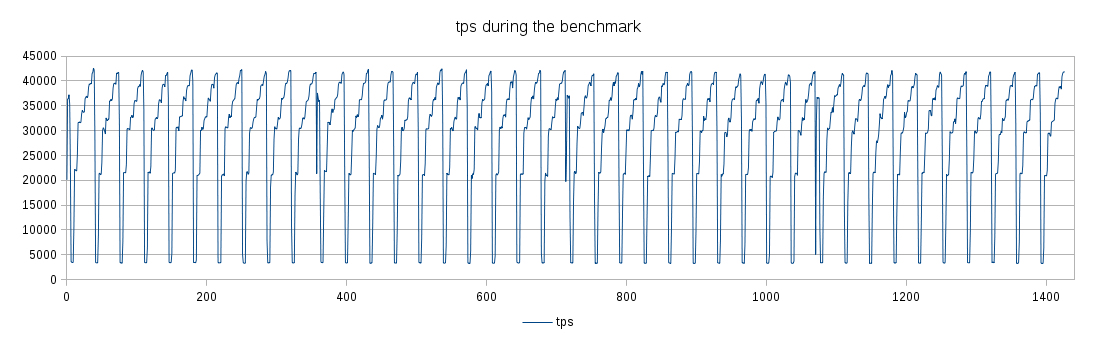
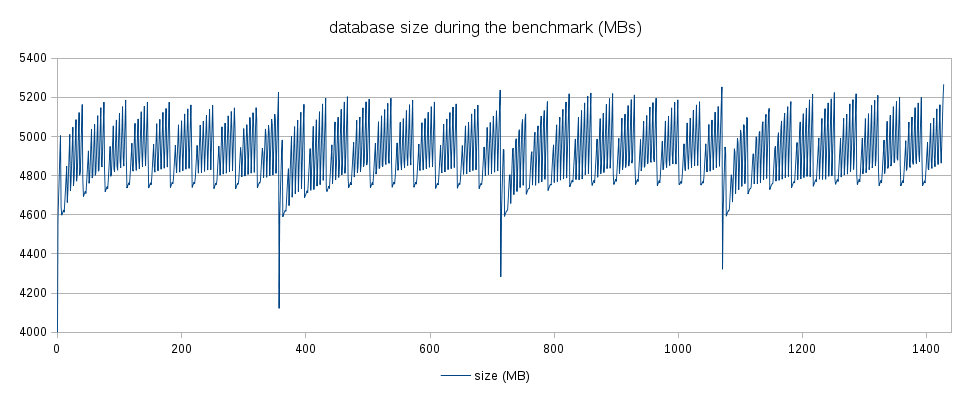
As for the warmup, possible impact of database bloat etc. Attached are
two charts, illustrating how tps and database looks like over the whole
benchmark on 4.5.5 (~1440 minutes). Clearly, the behavior is very stable
- the database size oscillates around 5GB (which easily fits into
shared_buffers), and the tps is very stable over the 10 runs. If the
warmup (or run duration) was insufficient, there'd be visible behavior
changes during the benchmark. So I believe the parameters are appropriate.
I've realized there actually is 3.10.101 kernel available on the
machine, so I'll repeat the pgbench on it too - perhaps that'll give us
some comparison to cthulhu, which is running 3.10 kernel too.
Then I'll run Dilip's workload on those three kernels (so far only the
simple pgbench was measured).
regards
--
Tomas Vondra http://www.2ndQuadrant.com
PostgreSQL Development, 24x7 Support, Remote DBA, Training & Services
| Attachment | Content-Type | Size |
|---|---|---|
| db-size.png | image/png | 75.0 KB |
| result.ods | application/vnd.oasis.opendocument.spreadsheet | 46.0 KB |
|
image/png | 63.2 KB |
In response to
- Re: Speed up Clog Access by increasing CLOG buffers at 2016-09-24 18:28:57 from Tomas Vondra
Responses
- Re: Speed up Clog Access by increasing CLOG buffers at 2016-09-26 18:48:55 from Tomas Vondra
Browse pgsql-hackers by date
| From | Date | Subject | |
|---|---|---|---|
| Next Message | Robert Haas | 2016-09-26 17:28:47 | Re: Showing parallel status in \df+ |
| Previous Message | David G. Johnston | 2016-09-26 16:23:52 | Re: [HACKERS] temporary table vs array performance |