Re: checkpointer continuous flushing
| From: | Tomas Vondra <tomas(dot)vondra(at)2ndquadrant(dot)com> |
|---|---|
| To: | pgsql-hackers(at)postgresql(dot)org |
| Subject: | Re: checkpointer continuous flushing |
| Date: | 2016-03-17 16:05:21 |
| Message-ID: | b826a30b-fa8c-1b24-da35-f975b4cc51c0@2ndquadrant.com |
| Views: | Whole Thread | Raw Message | Download mbox | Resend email |
| Thread: | |
| Lists: | pgsql-hackers |
Hi,
On 03/11/2016 02:34 AM, Andres Freund wrote:
> Hi,
>
> I just pushed the two major remaining patches in this thread. Let's see
> what the buildfarm has to say; I'd not be surprised if there's some
> lingering portability problem in the flushing code.
>
> There's one remaining issue we definitely want to resolve before the
> next release: Right now we always use one writeback context across all
> tablespaces in a checkpoint, but Fabien's testing shows that that's
> likely to hurt in a number of cases. I've some data suggesting the
> contrary in others.
>
> Things that'd be good:
> * Some benchmarking. Right now controlled flushing is enabled by default
> on linux, but disabled by default on other operating systems. Somebody
> running benchmarks on e.g. freebsd or OSX might be good.
So I've done some benchmarks of this, and I think the results are very
good. I've compared a298a1e06 and 23a27b039d (so the two patches
mentioned here are in-between those two), and I've done a few long
pgbench runs - 24h each:
1) master (a298a1e06), regular pgbench
2) master (a298a1e06), throttled to 5000 tps
3) patched (23a27b039), regular pgbench
3) patched (23a27b039), throttled to 5000 tps
All of this was done on a quite large machine:
* 4 x CPU E5-4620 (2.2GHz)
* 256GB of RAM
* 24x SSD on LSI 2208 controller (with 1GB BBWC)
The page cache was using the default config, although in production
setups we'd probably lower the limits (particularly the background
threshold):
* vm.dirty_background_ratio = 10
* vm.dirty_ratio = 20
The main PostgreSQL configuration changes are these:
* shared_buffers=64GB
* bgwriter_delay = 10ms
* bgwriter_lru_maxpages = 1000
* checkpoint_timeout = 30min
* max_wal_size = 64GB
* min_wal_size = 32GB
I haven't touched the flush_after values, so those are at default. Full
config in the github repo, along with all the results and scripts used
to generate the charts etc:
https://github.com/tvondra/flushing-benchmark
I'd like to see some benchmarks on machines with regular rotational
storage, but I don't have a suitable system at hand.
The pgbench was scale 60000, so ~750GB of data on disk, and was executed
either like this (the "default"):
pgbench -c 32 -j 8 -T 86400 -l --aggregate-interval=1 pgbench
or like this ("throttled"):
pgbench -c 32 -j 8 -T 86400 -R 5000 -l --aggregate-interval=1 pgbench
The reason for the throttling is that people generally don't run
production databases 100% saturated, so it'd be sad to improve the 100%
saturated case and hurt the common case by increasing latency. The
machine does ~8000 tps, so 5000 tps is ~60% of that.
It's difficult to judge based on a single run (although a long one), but
it seems the throughput increased a tiny bit from 7725 to 8000. That's
~4% difference, but I guess more runs would be needed to see if this is
noise or actual improvement.
Now, let's see at the per-second results, i.e. how much the performance
fluctuates over time (due to checkpoints etc.). That's where the
aggregated log (per-second) gets useful, as it's used for generating the
various charts for tps, max latency, stddev of latency etc.
All those charts are CDF, i.e. cumulative distribution function, i.e.
they plot a metric on x-axis, and probability P(X <= x) on y-axis.
In general the steeper the curve the better (more consistent behavior
over time). It also allows comparing two curves - e.g. for tps metric
the "lower" curve is better, as it means higher values are more likely.
default (non-throttled) pgbench runs
------------------------------------
Let's see the regular (non-throttled) pgbench runs first:
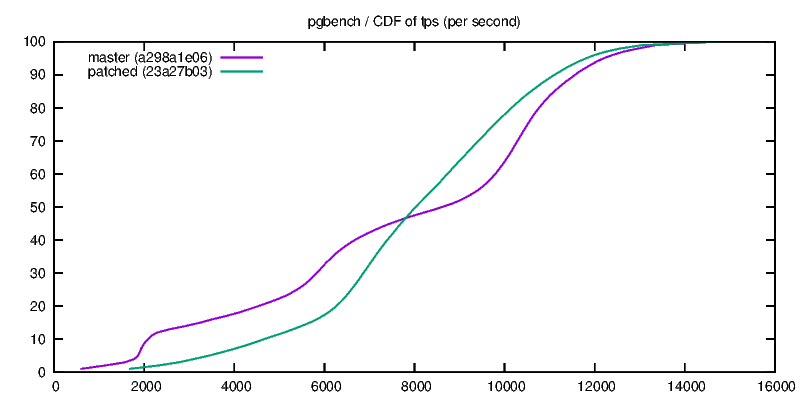
* regular-tps.png (per-second TPS)
Clearly, the patched version is much more consistent - firstly it's much
less "wobbly" and it's considerably steeper, which means the per-second
throughput fluctuates much less. That's good.
We already know the total throughput is almost exactly the same (just 4%
difference), this also shows that the medians are almost exactly the
same (the curves intersect at pretty much exactly 50%).
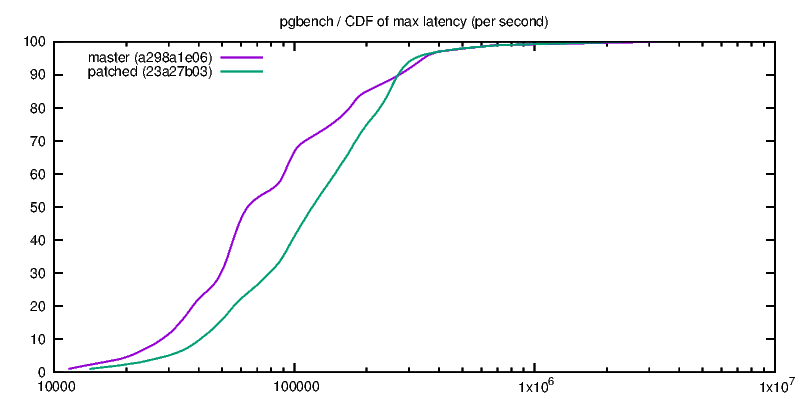
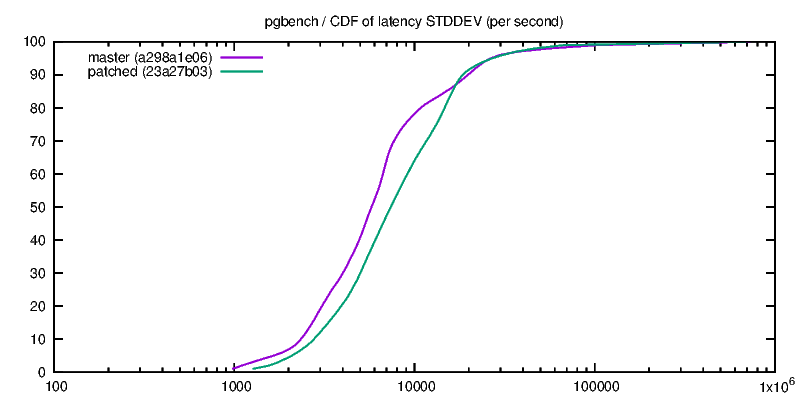
* regular-max-lat.png (per-second maximum latency)
* regular-stddev-lat.png (per-second latency stddev)
Apparently the additional processing slightly increases both the maximum
latency and standard deviation, as the green line (patched) is
consistently below the pink one (unpatched).
Notice however that x-axis is using log scale, so the differences are
actually very small, and we also know that the total throughput slightly
increased. So while those two metrics slightly increased, the overall
impact on latency has to be positive.
throttled pgbench runs
----------------------
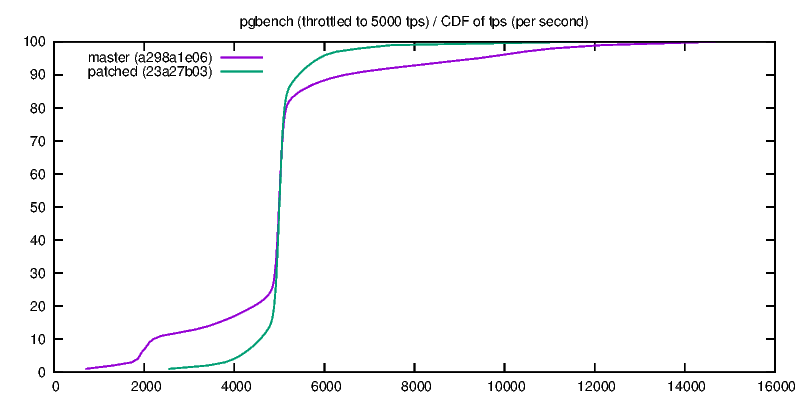
* throttled-tps.png (per-second TPS)
OK, this is great - the chart shows that the performance is way more
consistent. Originally there was ~10% of samples with ~2000 tps, but
with the flushing you'd have to go to ~4600 tps. It's actually pretty
difficult to determine this from the chart, because the curve got so
steep and I had to check the data used to generate the charts.
Similarly for the upper end, but I assume that's a consequence of the
throttling not having to compensate for the "slow" seconds anymore.
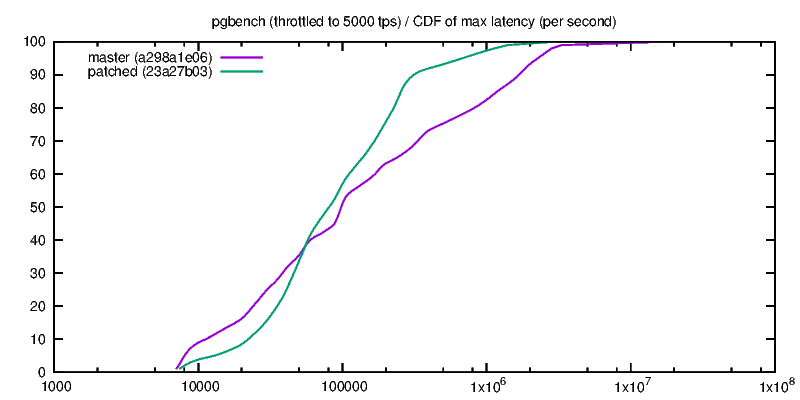
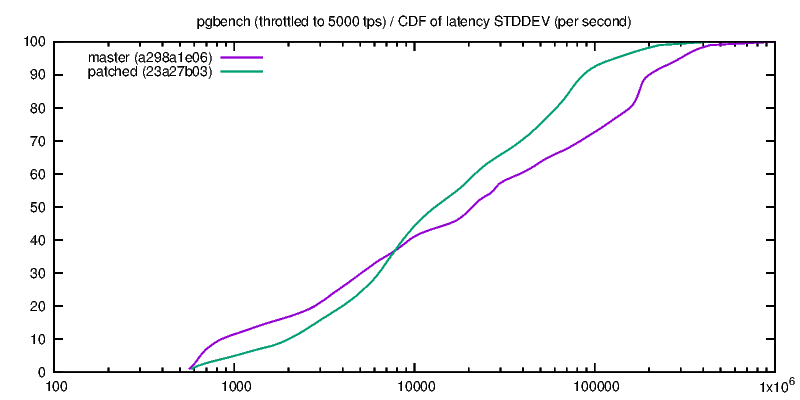
* throttled-max-lat.png (per-second maximum latency)
* throttled-stddev-lat.png (per-second latency stddev)
This time the stddev/max latency charts are actually in favor of the
patched code. It's actually a bit worse for the low latencies (the green
line is below the pink one, so there are fewer low values), but then it
starts winning for higher values. And that's what counts when it comes
to consistency.
Again, notice that the x-axis is log scale, so the differences for large
values are actually way more significant than it might look.
So, good work I guess!
regards
--
Tomas Vondra http://www.2ndQuadrant.com
PostgreSQL Development, 24x7 Support, Remote DBA, Training & Services
| Attachment | Content-Type | Size |
|---|---|---|
|
image/png | 10.9 KB |
|
image/png | 11.0 KB |
|
image/png | 10.7 KB |
|
image/png | 11.4 KB |
|
image/png | 11.6 KB |
|
image/png | 9.5 KB |
In response to
- Re: checkpointer continuous flushing at 2016-03-11 01:34:26 from Andres Freund
Responses
- Re: checkpointer continuous flushing at 2016-03-17 17:36:58 from Fabien COELHO
Browse pgsql-hackers by date
| From | Date | Subject | |
|---|---|---|---|
| Next Message | Corey Huinker | 2016-03-17 16:12:08 | Re: Re: Add generate_series(date,date) and generate_series(date,date,integer) |
| Previous Message | Tom Lane | 2016-03-17 16:04:46 | Re: Re: Add generate_series(date,date) and generate_series(date,date,integer) |