RE: WIP: WAL prefetch (another approach)
| From: | Jakub Wartak <Jakub(dot)Wartak(at)tomtom(dot)com> |
|---|---|
| To: | Thomas Munro <thomas(dot)munro(at)gmail(dot)com>, Stephen Frost <sfrost(at)snowman(dot)net>, Alvaro Herrera <alvherre(at)2ndquadrant(dot)com> |
| Cc: | Tomas Vondra <tomas(dot)vondra(at)enterprisedb(dot)com>, Tomas Vondra <tomas(dot)vondra(at)2ndquadrant(dot)com>, Dmitry Dolgov <9erthalion6(at)gmail(dot)com>, David Steele <david(at)pgmasters(dot)net>, Andres Freund <andres(at)anarazel(dot)de>, pgsql-hackers <pgsql-hackers(at)postgresql(dot)org> |
| Subject: | RE: WIP: WAL prefetch (another approach) |
| Date: | 2020-12-11 12:24:29 |
| Message-ID: | VI1PR0701MB69608CBCE44D80857E59572EF6CA0@VI1PR0701MB6960.eurprd07.prod.outlook.com |
| Views: | Whole Thread | Raw Message | Download mbox | Resend email |
| Thread: | |
| Lists: | pgsql-hackers |
Thomas wrote:
> Here's a rebase over the recent commit "Get rid of the dedicated latch for
> signaling the startup process." just to fix cfbot; no other changes.
I wanted to contribute my findings - after dozens of various lengthy runs here - so far with WAL (asynchronous) recovery performance in the hot-standby case. TL;DR; this patch is awesome even on NVMe 😉
This email is a little bit larger topic than prefetching patch itself, but I did not want to loose context. Maybe it'll help somebody in operations or just to add to the general pool of knowledge amongst hackers here, maybe all of this stuff was already known to you. My plan is to leave it here like that as I'm probably lacking understanding, time, energy and ideas how to tweak it more.
SETUP AND TEST:
---------------
There might be many different workloads, however I've only concentrated on single one namely - INSERT .. SELECT 100 rows - one that was predictible enough for me, quite generic and allows to uncover some deterministic hotspots. The result is that in such workload it is possible to replicate ~750Mbit/s of small rows traffic in stable conditions (catching-up is a different matter).
- two i3.4xlarge AWS VMs with 14devel, see [0] for specs. 14devel already contains major optimizations of reducing lseeks() and SLRU CLOG flushing[1]
- WIP WAL prefetching [2] by Thomas Munro applied, v14_000[12345] patches, especially v14_0005 is important here as it reduces dynahash calls.
- FPWs were disabled to avoid hitting >2.5Gbps traffic spikes
- hash_search_with_hash_value_memcmpopt() is my very poor man's copycat optimization of dynahash.c's hash_search_with_hash_value() to avoid indirect function calls of calling match() [3]
- VDSO clock_gettime() just in case fix on AWS, tsc for clocksource0 instead of "xen" OR one could use track_io_timing=off to reduce syscalls
Primary tuning:
in order to reliably measure standby WAL recovery performance, one needs to setup *STABLE* generator over time/size, on primary. In my case it was 2 indexes and 1 table: pgbench -n -f inserts.pgb -P 1 -T 86400 -c 16 -j 2 -R 4000 --latency-limit=50 db.
VFS-CACHE-FITTING WORKLOAD @ 4k TPS:
------------------------------------
create sequence s1;
create table tid (id bigint primary key, j bigint not null, blah text not null) partition by hash (id);
create index j_tid on tid (j); -- to put some more realistic stress
create table tid_h1 partition of tid FOR VALUES WITH (MODULUS 16, REMAINDER 0);
[..]
create table tid_h16 partition of tid FOR VALUES WITH (MODULUS 16, REMAINDER 15);
The clients (-c 16) needs to aligned with hash-partitioning to avoid LWLock/BufferContent. inserts.pgb was looking like:
insert into tid select nextval('s1'), g, 'some garbage text' from generate_series(1,100) g.
The sequence is of the key importance here. "g" is more or less randomly hitting here (the j_tid btree might quite grow on standby too).
Additionally due to drops on primary, I've disabled fsync as a stopgap measure because at least what to my understanding I was affected by global freezes of my insertion workload due to Lock/extends as one of the sessions was always in: mdextend() -> register_dirty_segment() -> RegisterSyncRequest() (fsync pg_usleep 0.01s), which caused frequent dips of performance even at the begginig (visible thanks to pgbench -P 1) and I wanted something completely linear. The fsync=off was simply a shortcut just in order to measure stuff properly on the standby (I needed this deterministic "producer").
The WAL recovery is not really single threaded thanks to prefetches with posix_fadvises() - performed by other (?) CPUs/kernel threads I suppose, CLOG flushing by checkpointer and the bgwriter itself. The walsender/walreciever were not the bottlenecks, but bgwriter and checkpointer needs to be really tuned on *standby* side too.
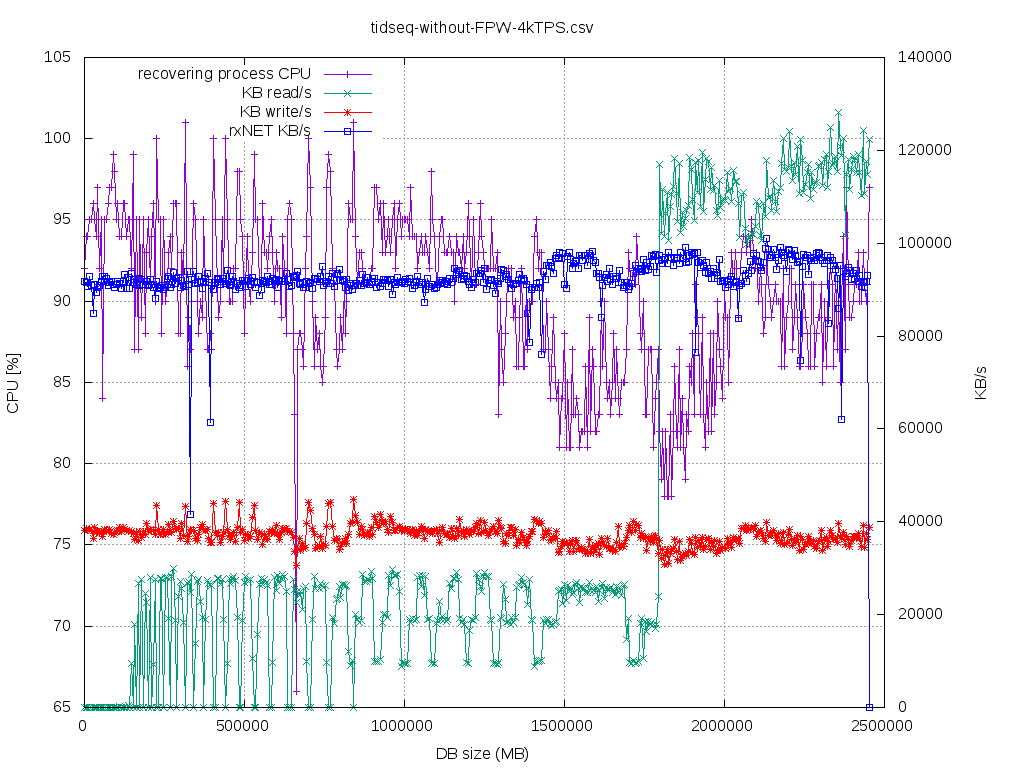
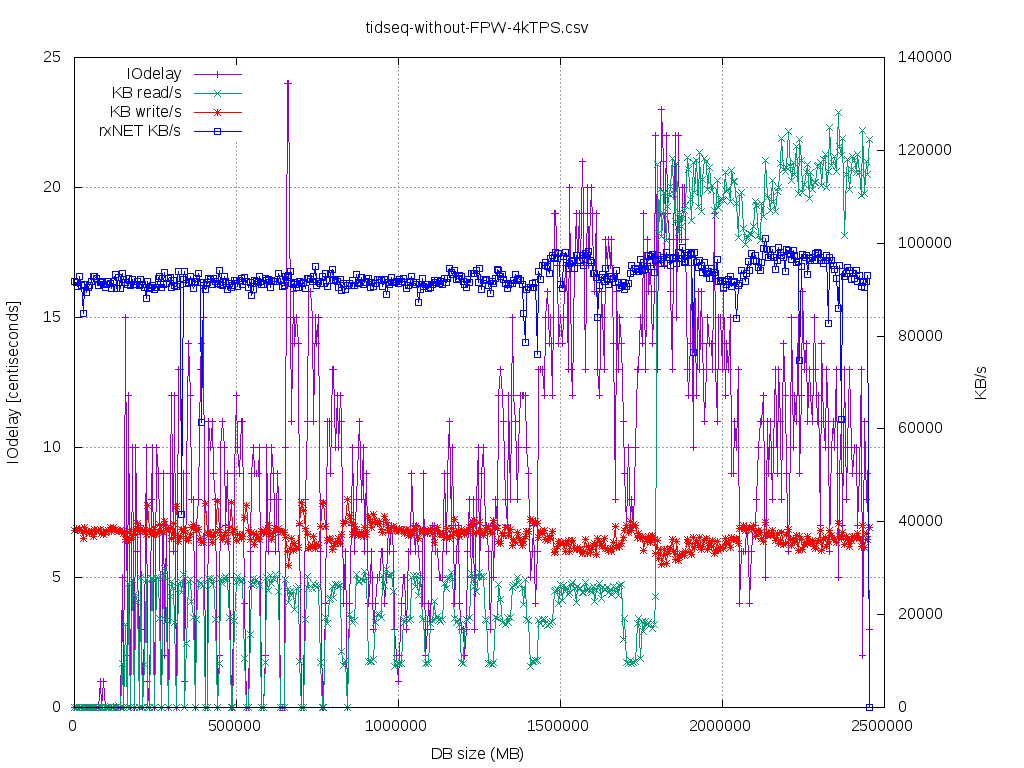
So, the above workload is CPU bound on the standby side for long time. I would classify it as "standby-recovery-friendly" as the IO-working-set of the main redo loop does NOT degrade over time/dbsize that much, so there is no lag till certain point. In order to classify the startup/recovery process one could use recent pidstat(1) -d "iodelay" metric. If one gets stable >= 10 centiseconds over more than few seconds, then one has probably I/O driven bottleneck. If iodelay==0 then it is completely VFS-cached I/O workload.
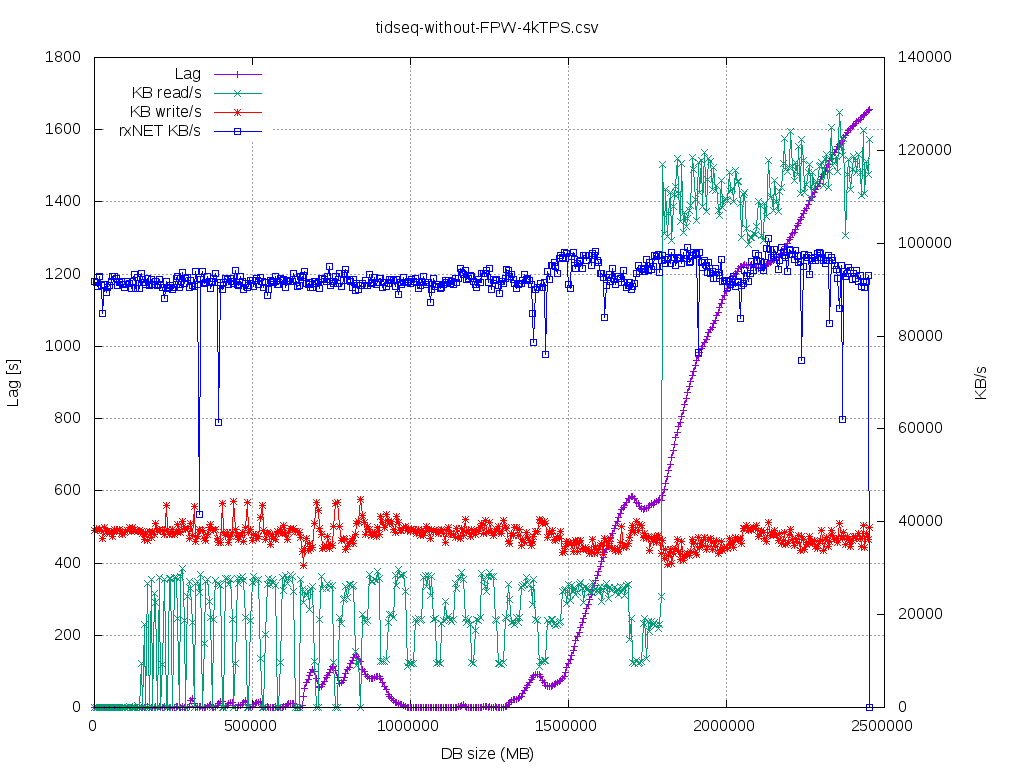
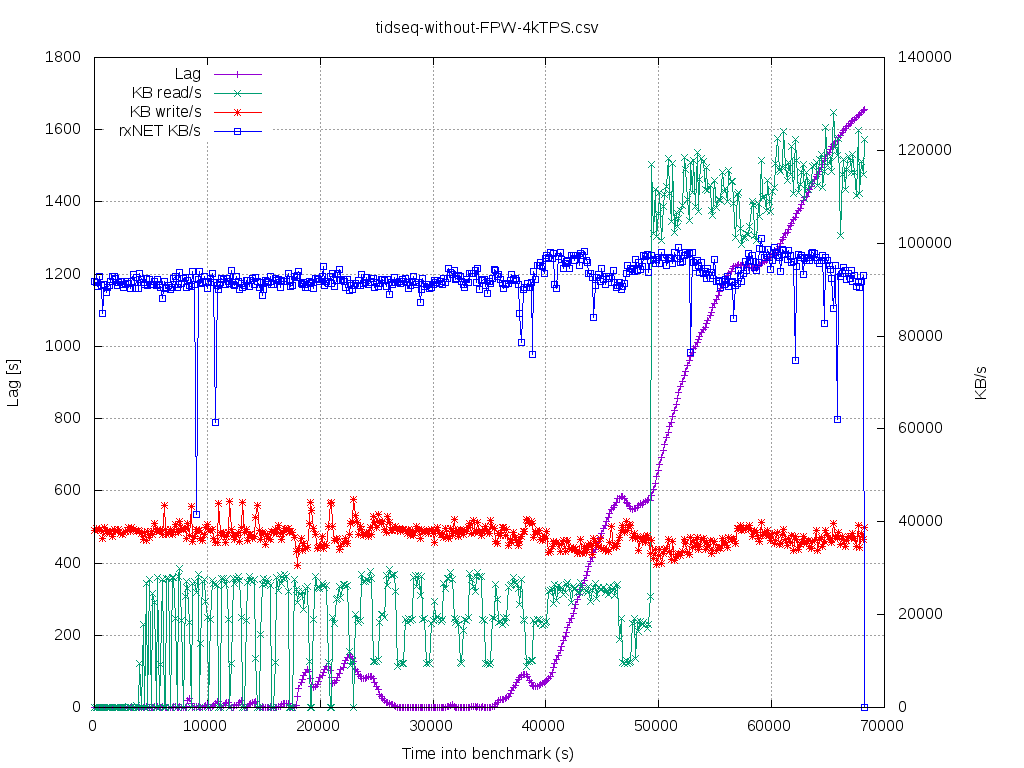
In such setup, primary can generate - without hiccups - 6000-6500 TPS (insert 100 rows) @ ~25% CPU util using 16 DB sessions. Of course it could push more, but we are using pgbench throttling. Standby can follow up to @ ~4000 TPS on the primary, without lag (@ 4500 TPS was having some lag even at start). The startup/recovering gets into CPU 95% utilization territory with ~300k (?) hash_search_with_hash_value_memcmpopt() executions per second (measured using perf-probe). The shorter the WAL record the more CPU-bound the WAL recovery performance is going to be. In my case ~220k WAL records @ WAL segment 16MB and I was running at stable 750Mbit/s. What is important - at least on my HW - due to dynahashs there's hard limit of this ~300..400 k WAL records/s (perf probe/stat reports that i'm having 300k of hash_search_with_hash_value_memcmpopt() / s, while my workload is 4k [rate] * 100 [rows] * 3 [table + 2 indexes] = 400k/s and no lag, discrepancy that I admit do not understand, maybe it's the Thomas's recent_buffer_fastpath from v14_0005 prefetcher). On some other OLTP production systems I've seen that there's 10k..120k WAL records/16MB segment. The perf picture looks like one in [4]. The "tidseq-*" graphs are about this scenario.
One could say that with lesser amount of bigger rows one could push more on the network and that's true however unrealistic in real-world systems (again with FPW=off, I was able to push up to @ 2.5Gbit/s stable without lag, but twice less rate and much bigger rows - ~270 WAL records/16MB segment and primary being the bottleneck). The top#1 CPU function was quite unexpectedly again the BufTableLookup() -> hash_search_with_hash_value_memcmpopt() even at such relatively low-records rate, which illustrates that even with a lot of bigger memcpy()s being done by recovery, those are not the problem as one would typically expect.
VFS-CACHE-MISSES WORKLOAD @ 1.5k TPS:
-------------------------------------
Interesting behavior is that for the very similar data-loading scheme as described above, but for uuid PK and uuid_generate_v4() *random* UUIDs (pretty common pattern amongst developers), instead of bigint sequence, so something very similar to above like:
create table trandomuuid (id uuid primary key , j bigint not null, t text not null) partition by hash (id);
... picture radically changes if the active-working-I/O-set doesn't fit VFS cache and it's I/O bound on recovery side (again this is with prefetching already). This can checked via iodelay: if it goes let's say >= 10-20 centiseconds or BCC's cachetop(1) shows "relatively low" READ_HIT% for recovering (poking at it was ~40-45% in my case when recovery started to be really I/O heavy):
DBsize(at)112GB , 1s sample:
13:00:16 Buffers MB: 200 / Cached MB: 88678 / Sort: HITS / Order: descending
PID UID CMD HITS MISSES DIRTIES READ_HIT% WRITE_HIT%
1849 postgres postgres 160697 67405 65794 41.6% 1.2% -- recovering
1853 postgres postgres 37011 36864 24576 16.8% 16.6% -- walreciever
1851 postgres postgres 15961 13968 14734 4.1% 0.0% -- bgwriter
On 128GB RAM, when DB size gets near the ~80-90GB boundary (128-32 for huge pages - $binaries - $kernel - $etc =~ 90GB free page cache) SOMETIMES in my experiments it started getting lag, but also at the same time even the primary cannot keep at rate of 1500TPS (IO/DataFileRead|Write may happen or still Lock/extend) and struggles of course this is well known behavior [5]. Also in this almost-pathological-INSERT-rate had pgstat_bgwriter.buffers_backend like 90% of buffers_alloc and I couldn't do much anything about it (small s_b on primary, tuning bgwriter settings to the max, even with bgwriter_delay=0 hack, BM_MAX_USAGE_COUNT=1). Any suggestion on how to make such $workload deterministic after certain DBsize under pgbench -P1 is welcome :)
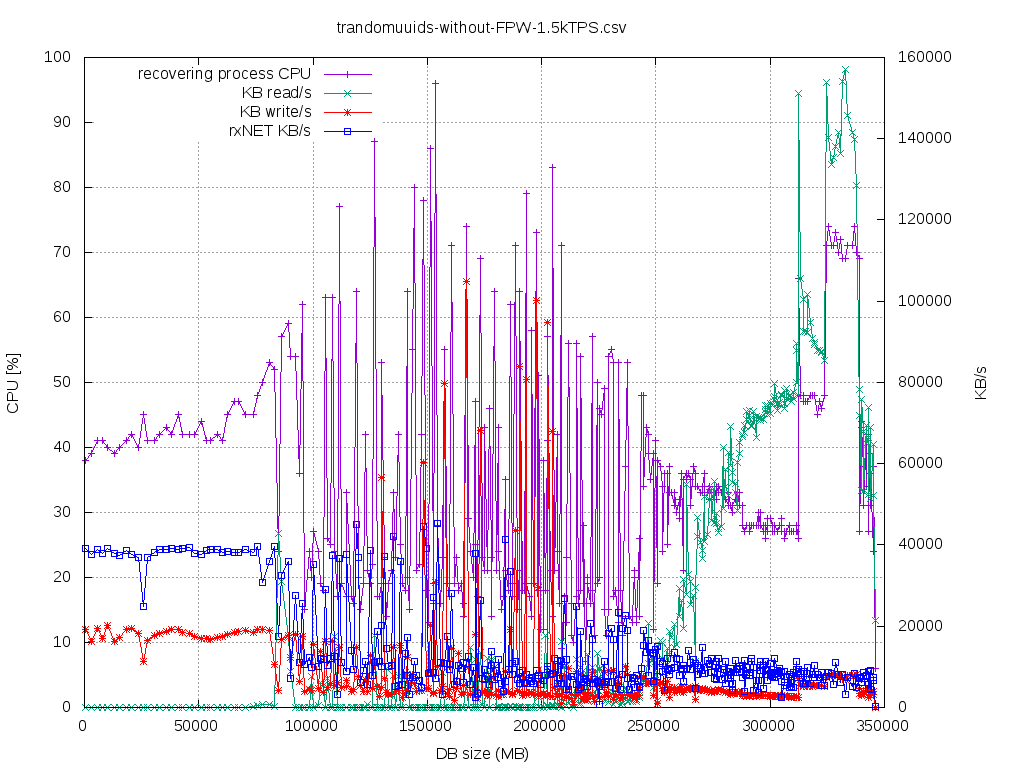
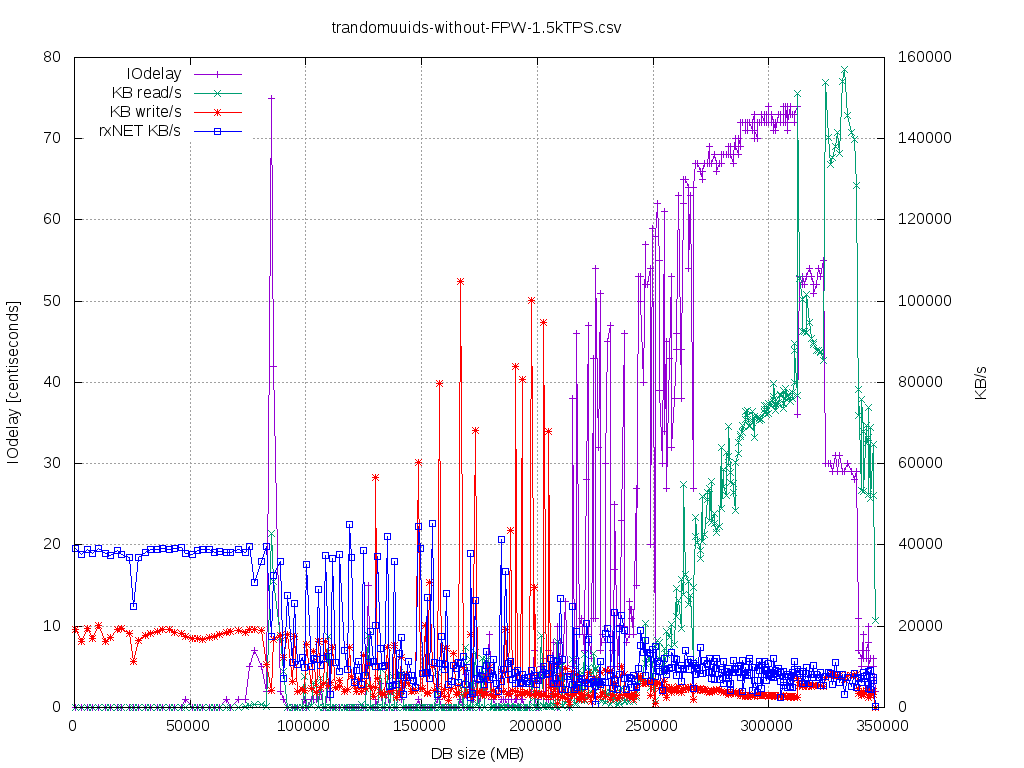
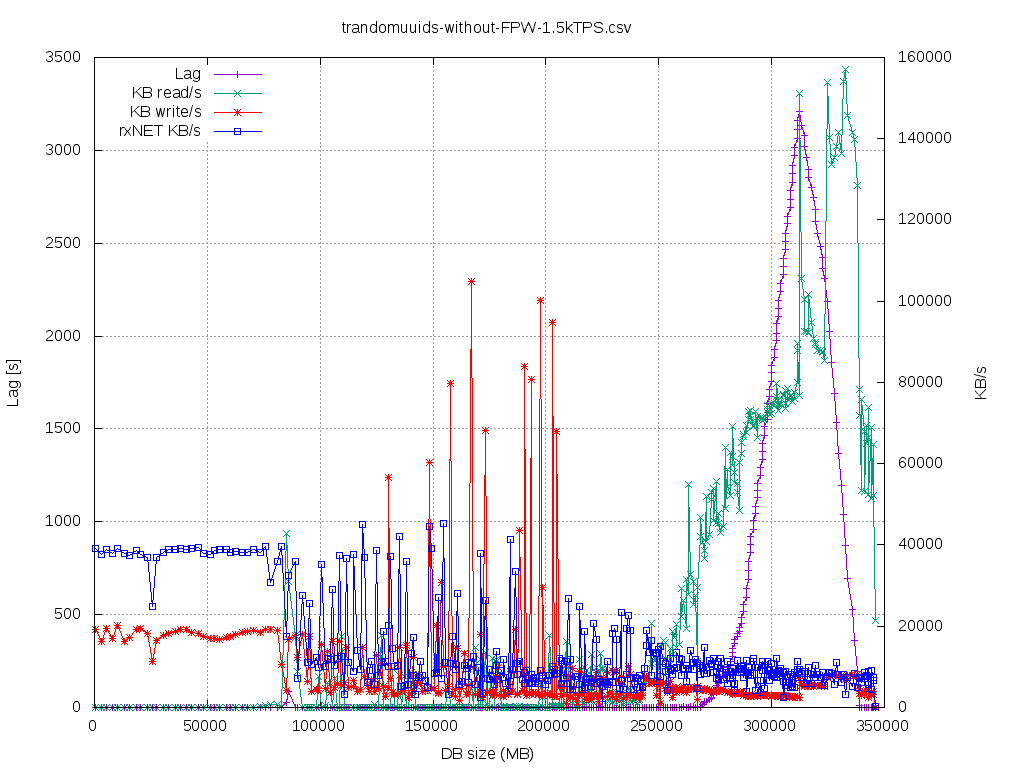
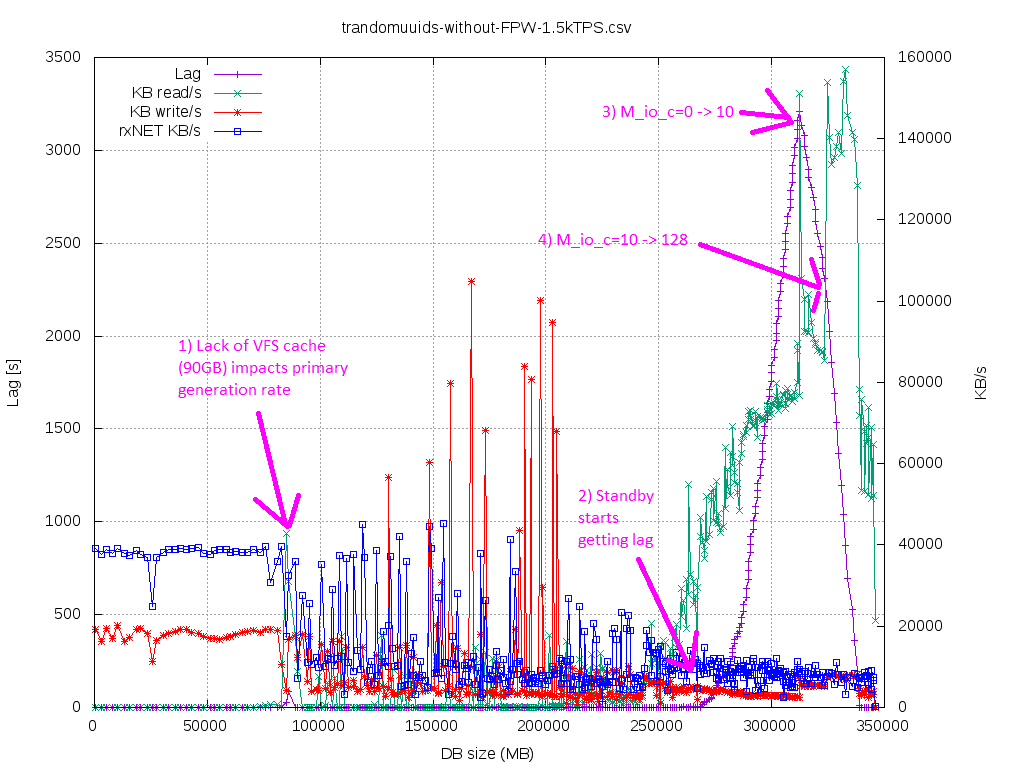
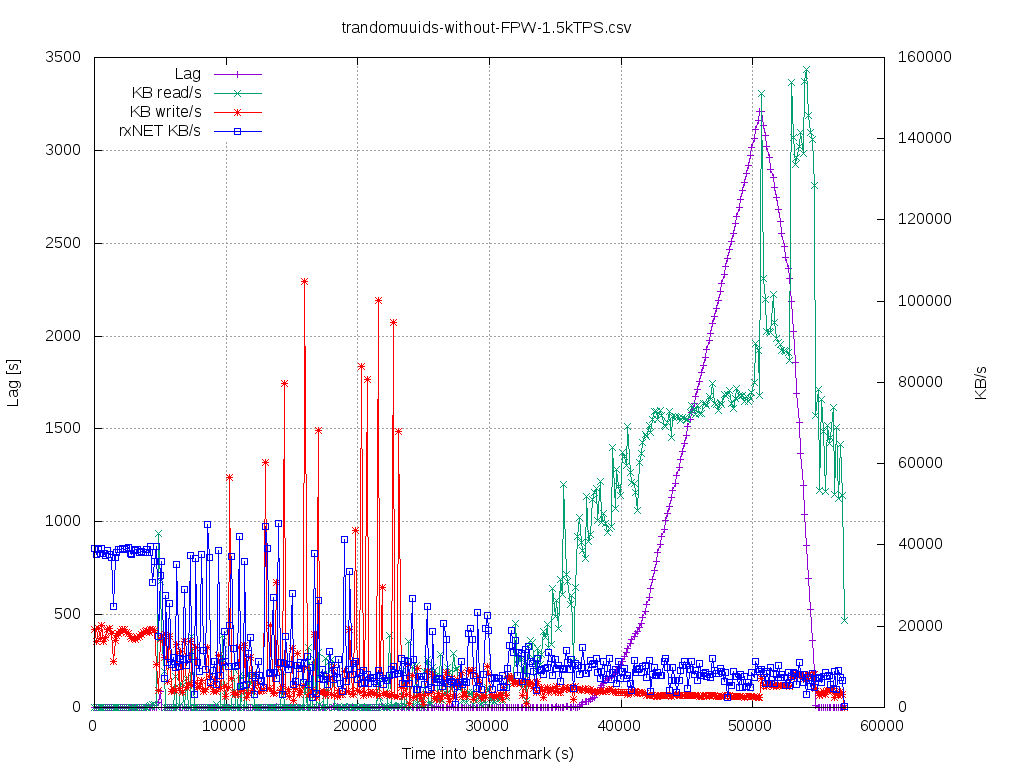
So in order to deterministically - in multiple runs - demonstrate the impact of WAL prefetching by Thomas in such scenario (where primary was bottleneck itself), see "trandomuuid-*" graphs, one of the graphs has same commentary as here:
- the system is running with WAL prefetching disabled (maitenance_io_concurrency=0)
- once the DBsize >85-90GB primary cannot keep up, so there's drop of data produced - rxNET KB/s. At this stage I've did echo 3> drop_caches, to shock the system (there's very little jump of Lag, buit it goes to 0 again -- good, standby can still manage)
- once the DBsize got near ~275GB standby couldn't follow even-the-chocked-primary (lag starts rising to >3000s, IOdelay indicates that startup/recovering is wasting like 70% of it's time on synchronous preads())
- at DBsize ~315GB I've did set maitenance_io_concurrency=10 (enable the WAL prefetching/posix_fadvise()), lags starts dropping, and IOdelay is reduced to ~53, %CPU (not %sys) of the process jumps from 28% -> 48% (efficiency grows)
- at DBsize ~325GB I've did set maitenance_io_concurrency=128 (give kernel more time to pre-read for us), lags starts dropping even faster, and IOdelay is reduced to ~30, %CPU part (not %sys) of the process jumps from 48% -> 70% (it's efficiency grows again, 2.5x more from baseline)
Another interesting observation is that standby's bgwriter is much more stressed and important than the recovery itself and several times more active than the one on primary. I've rechecked using Tomas Vondra's sequuid extension [6] and of course problem doesn't exist if the UUIDs are not that random (much more localized, so this small workload adjustment makes it behave like in "VFS-CACHE-fitting" scenario).
Also just in case for the patch review process: also I can confirm that data inserted in primary and standby did match on multiple occasions (sums of columns) after those tests (some of those were run up to 3TB mark).
Random thoughts:
----------------
1) Even with all those optimizations, I/O prefetching (posix_fadvise()) or even IO_URING in future there's going be the BufTableLookup()->dynahash single-threaded CPU limitation bottleneck. It may be that with IO_URING in future and proper HW, all workloads will start to be CPU-bound on standby ;) I do not see a simple way to optimize such fundamental pillar - other than parallelizing it ? I hope I'm wrong.
1b) With the above patches I need to disappoint Alvaro Herrera, I was unable to reproduce the top#1 smgropen() -> hash_search_with_hash_value() in any way as I think right now v14_0005 simply kind of solves the problem.
2) I'm kind of thinking that flushing dirty pages on standby should be much more aggressive than on primary, in order to unlock the startup/recovering potential. What I'm trying to say it might be even beneficial to spot if FlushBuffer() is happening too fast from inside the main redo recovery loop, and if it is then issue LOG/HINT from time to time (similar to famous "checkpoints are occurring too frequently") to tune the background writer on slave or investigate workload itself on primary. Generally speaking those "bgwriter/checkpointer" GUCs might be kind of artificial during the standby-processing scenario.
3) The WAL recovery could (?) have some protection from noisy neighboring backends. As the hot standby is often used in read offload configurations it could be important to protect it's VFS cache (active, freshly replicated data needed for WAL recovery) from being polluted by some other backends issuing random SQL SELECTs.
4) Even for scenarios with COPY/heap_multi_insert()-based-statements it emits a lot of interleaved Btree/INSERT_LEAF records that are CPU heavy if the table is indexed.
6) I don't think walsender/walreciever are in any danger right now, as they at least in my case they had plenty of headroom (even @ 2.5Gbps walreciever was ~30-40% CPU) while issuing I/O writes of 8kB (but this was with fsync=off and on NVMe). Walsender was even in better shape mainly due to sendto(128kB). YMMV.
7) As uuid-osp extension is present in the contrib and T.V.'s sequential-uuids is unfortunately NOT, developers more often than not, might run into those pathological scenarios. Same applies to any cloud-hosted database where one cannot deploy his extensions.
What was not tested and what are further research questions:
-----------------------------------------------------------
a) Impact of vacuum WAL records: I suspect that it might be that additional vacuum-generated workload that was added to the mix, during the VFS-cache-fitting workload that overwhelmed the recovering loop and it started catching lag.
b) Impact of the noisy-neighboring-SQL queries on hot-standby:
b1) research the impact of contention LWLock buffer_mappings between readers and recovery itself.
b2) research/experiments maybe with cgroups2 VFS-cache memory isolation for processes.
c) Impact of WAL prefetching's "maintenance_io_concurrency" VS iodelay for startup/recovering preads() is also unknown. They key question there is how far ahead to issue those posix_fadvise() so that pread() is nearly free. Some I/O calibration tool to set maitenance_io_concurrency would be nice.
-J.
[0] - specs: 2x AWS i3.4xlarge (1s8c16t, 128GB RAM, Intel(R) Xeon(R) CPU E5-2686 v4 @ 2.30GH), 2xNVMe in lvm striped VG, ext4. Tuned parameters: bgwriter_*, s_b=24GB with huge pages, checkpoint_completion_target=0.9, commit_delay=100000, commit_siblings=20, synchronous_commit=off, fsync=off, max_wal_size=40GB, recovery_prefetch=on, track_io_timing=on , wal_block_size=8192 (default), wal_decode_buffer_size=512kB (default WIP WAL prefetching), wal_buffers=256MB. Schema was always 16-way hash-parititoned to avoid LWLock/BufferContent waits.
[2] - https://commitfest.postgresql.org/31/2410/
[3] - hash_search_with_hash_value() spends a lot of time near "callq *%r14" in tight loop assembly in my case (indirect call to hash comparision function). This hash_search_with_hash_value_memcmpopt() is just copycat function and instead directly calls memcmp() where it matters (smgr.c, buf_table.c). Blind shot at gcc's -flto also didn't help to gain a lot there (I was thinking it could optimize it by building many instances of hash_search_with_hash_value of per-match() use, but no). I did not quantify the benefit, I think it just failed optimization experiment, as it is still top#1 in my profiles, it could be even noise.
[4] - 10s perf image of CPU-bound 14devel with all the mentioned patches:
17.38% postgres postgres [.] hash_search_with_hash_value_memcmpopt
---hash_search_with_hash_value_memcmpopt
|--11.16%--BufTableLookup
| |--9.44%--PrefetchSharedBuffer
| | XLogPrefetcherReadAhead
| | StartupXLOG
| --1.72%--ReadBuffer_common
| ReadBufferWithoutRelcache
| XLogReadBufferExtended
| --1.29%--XLogReadBufferForRedoExtended
| --0.64%--XLogInitBufferForRedo
|--3.86%--smgropen
| |--2.79%--XLogPrefetcherReadAhead
| | StartupXLOG
| --0.64%--XLogReadBufferExtended
--2.15%--XLogPrefetcherReadAhead
StartupXLOG
10.30% postgres postgres [.] MarkBufferDirty
---MarkBufferDirty
|--5.58%--btree_xlog_insert
| btree_redo
| StartupXLOG
--4.72%--heap_xlog_insert
6.22% postgres postgres [.] ReadPageInternal
---ReadPageInternal
XLogReadRecordInternal
XLogReadAhead
XLogPrefetcherReadAhead
StartupXLOG
5.36% postgres postgres [.] hash_bytes
---hash_bytes
|--3.86%--hash_search_memcmpopt
[5] -
https://www.2ndquadrant.com/en/blog/on-the-impact-of-full-page-writes/
https://www.2ndquadrant.com/en/blog/sequential-uuid-generators/
https://www.2ndquadrant.com/en/blog/sequential-uuid-generators-ssd/
| Attachment | Content-Type | Size |
|---|---|---|
|
image/png | 31.7 KB |
|
image/png | 33.0 KB |
|
image/png | 29.1 KB |
|
image/png | 29.4 KB |
|
image/png | 32.1 KB |
|
image/png | 29.6 KB |
|
image/png | 27.3 KB |
|
image/png | 56.1 KB |
|
image/png | 28.4 KB |
In response to
- Re: WIP: WAL prefetch (another approach) at 2020-11-18 05:10:31 from Thomas Munro
Responses
- Re: WIP: WAL prefetch (another approach) at 2020-12-24 03:06:38 from Thomas Munro
Browse pgsql-hackers by date
| From | Date | Subject | |
|---|---|---|---|
| Next Message | Dean Rasheed | 2020-12-11 12:58:36 | Re: PoC/WIP: Extended statistics on expressions |
| Previous Message | Greg Nancarrow | 2020-12-11 11:00:47 | Re: Parallel INSERT (INTO ... SELECT ...) |