| From: | Anthonin Bonnefoy <anthonin(dot)bonnefoy(at)datadoghq(dot)com> |
|---|---|
| To: | Nikita Malakhov <hukutoc(at)gmail(dot)com> |
| Cc: | Aleksander Alekseev <aleksander(at)timescale(dot)com>, PostgreSQL Hackers <pgsql-hackers(at)postgresql(dot)org> |
| Subject: | Re: POC: Extension for adding distributed tracing - pg_tracing |
| Date: | 2023-08-30 09:09:32 |
| Message-ID: | CAO6_Xqruj6zj+_DhecKkpUvgjfReLwA_B_WVS_ag3CS7rzikLw@mail.gmail.com |
| Views: | Whole Thread | Raw Message | Download mbox | Resend email |
| Thread: | |
| Lists: | pgsql-hackers |
Hi!
> Storing spans is a tricky question. Monitoring systems often use pull model and use probes or SQL
> API for pulling data, so from this point of view it is much more convenient to keep spans in separate
> table. But in this case we come to another issue - how to flush this data into the table? Automatic
> flushing on a full buffer would randomly (to the user) significantly affect query performance. I'd rather
> make a GUC turned off by default to store spans into the table instead of buffer.
My main issue with having the extension flush spans in a table is that
it will only work on primaries.
Replicas won't be able to do this as they can't write data on tables
and having this flush function is likely going to introduce more
confusion if it only works on primaries.
From my point of view, processing the spans should be done by an
external application.Similar to my initial example which forward spans
to a trace collector
(https://gist.github.com/bonnefoa/6ed24520bdac026d6a6a6992d308bd50#file-main-go)
this application could instead store spans in a dedicated table. This
way, the creation of the table is outside pg_tracing's scope and the
span_store application will be able to store spans on replicas and
primaries.
How frequently this application should pull data to avoid full buffer
and dropping spans is a tricky part. We have stats so we can monitor
if drops are happening and adjust the spans buffer size or increase
the application's pull frequency. Another possibility (though I'm not
familiar with that) could be to use notifications. The application
will listen to a channel and pg_tracing will notify when a
configurable threshold is reached (i.e.: if the buffer reaches 50%,
send a notification).
> I've checked this behavior before and haven't noticed the case you mentioned, but for
> loops like
> for i in 1..2 loop
> StartTime := clock_timestamp();
> insert into t2 values (i, a_data);
> EndTime := clock_timestamp();
> Delta := 1000 * ( extract(epoch from EndTime) - extract(epoch from StartTime) );
> end loop;
Was this run through psql? In this case, you would be using simple
protocol which always drops the portal at the end of the statement and
is not triggering the issue.
With extended protocol and a multi statement transactions, I have the
following backtrace:
* frame #0: 0x0000000104581318
postgres`ExecutorEnd(queryDesc=0x00000001420083b0) at execMain.c:471:6
frame #1: 0x00000001044e1644
postgres`PortalCleanup(portal=0x0000000152031d00) at
portalcmds.c:299:4
frame #2: 0x0000000104b0e77c
postgres`PortalDrop(portal=0x0000000152031d00, isTopCommit=false) at
portalmem.c:503:3
frame #3: 0x0000000104b0e3e8 postgres`CreatePortal(name="",
allowDup=true, dupSilent=true) at portalmem.c:194:3
frame #4: 0x000000010487a308
postgres`exec_bind_message(input_message=0x000000016bb4b398) at
postgres.c:1745:12
frame #5: 0x000000010487846c
postgres`PostgresMain(dbname="postgres", username="postgres") at
postgres.c:4685:5
frame #6: 0x0000000104773144
postgres`BackendRun(port=0x0000000141704080) at postmaster.c:4433:2
frame #7: 0x000000010477044c
postgres`BackendStartup(port=0x0000000141704080) at
postmaster.c:4161:3
frame #8: 0x000000010476d6fc postgres`ServerLoop at postmaster.c:1778:6
frame #9: 0x000000010476c260 postgres`PostmasterMain(argc=3,
argv=0x0000600001cf72c0) at postmaster.c:1462:11
frame #10: 0x0000000104625ca8 postgres`main(argc=3,
argv=0x0000600001cf72c0) at main.c:198:3
frame #11: 0x00000001a61dbf28 dyld`start + 2236
At this point, the new statement is already parsed and it's only
during the bind that the previous' statement portal is dropped and
ExecutorEnd is called. Thus, we have overlapping statements which are
tricky to handle.
On my side, I've made the following changes:
Skip nodes that are not executed
Fix query_id propagation, it should now be associated with all the
spans of a query when available
I've forgotten to add the spans buffer in the shmem hook so it would
crash when pg_tracing.max_span was too high. Now it's fixed and we can
request more than 2000 spans. Currently, the size of Span is 320 bytes
so 50000 will take ~15MB of memory.
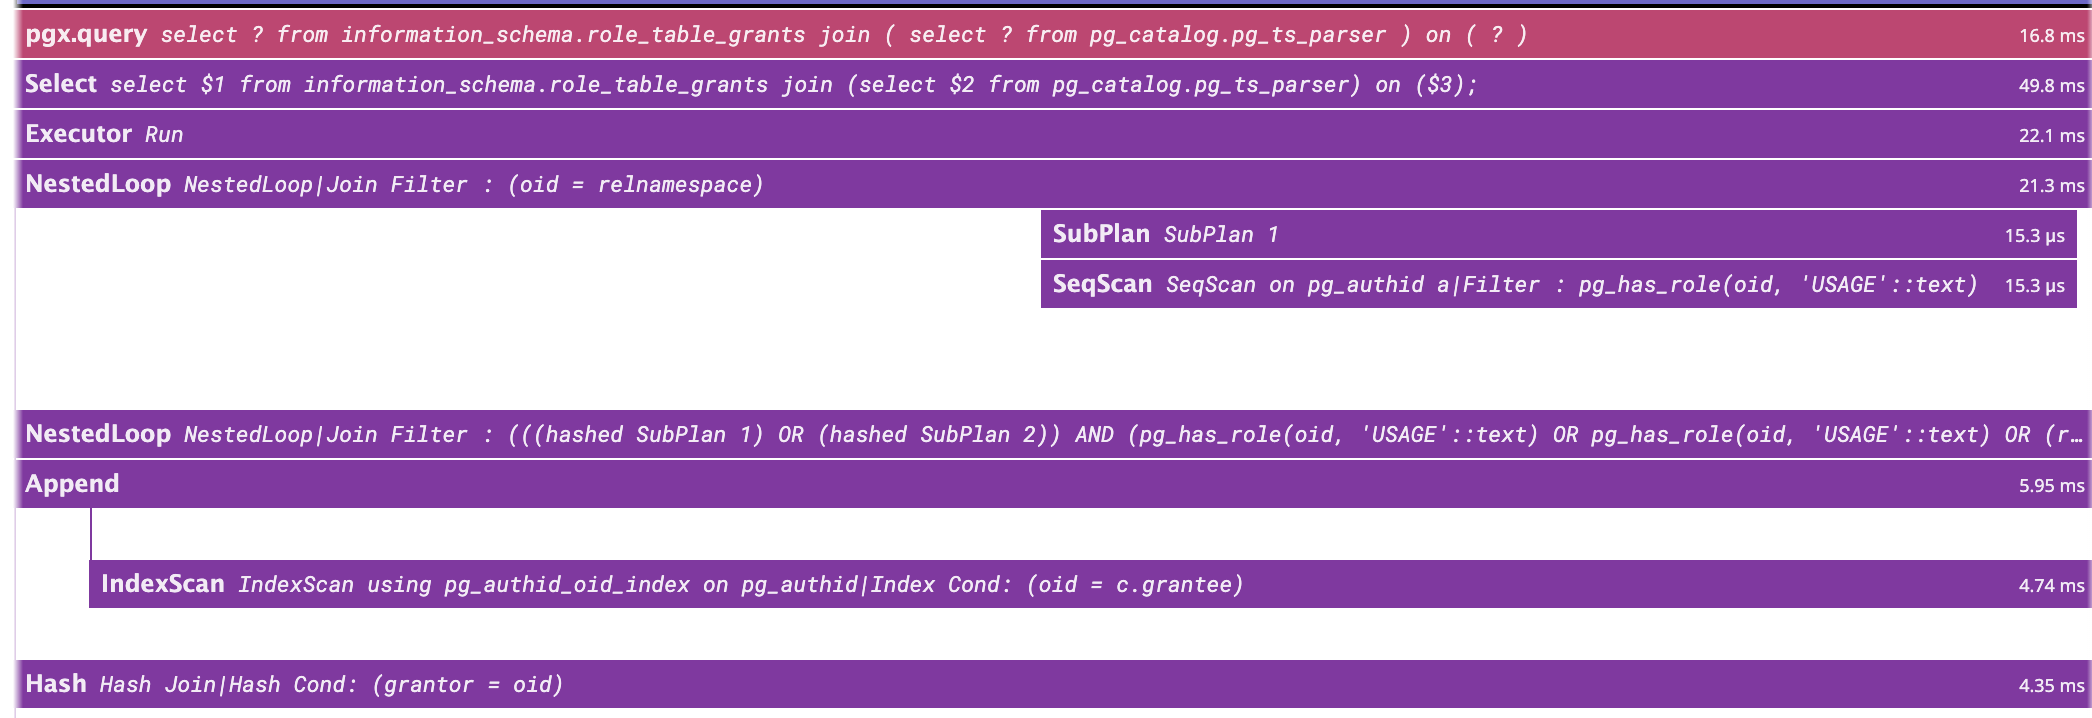
I've added the subplan/init plan spans and started experimenting
deparsing the plan to add more details on the nodes. Instead of
'NestedLoop', we will have something 'NestedLoop|Join Filter : (oid =
relnamespace)'. One consequence is that it will create a high number
of different operations which is something we want to avoid with trace
collectors. I'm probably gonna move this outside the operation name or
find a way to make this more stable.
I've started initial benchmarks and profiling. On a default
installation and running a default `pgbench -T15`, I have the
following:
Without pg_tracing: tps = 953.118759 (without initial connection time)
With pg_tracing: tps = 652.953858 (without initial connection time)
Most of the time is spent process_query_desc. I haven't tried to
optimize performances yet so there's probably a lot of room for
improvement.
On Mon, Aug 14, 2023 at 11:17 AM Nikita Malakhov <hukutoc(at)gmail(dot)com> wrote:
>
> Hi!
>
> Storing spans is a tricky question. Monitoring systems often use pull model and use probes or SQL
> API for pulling data, so from this point of view it is much more convenient to keep spans in separate
> table. But in this case we come to another issue - how to flush this data into the table? Automatic
> flushing on a full buffer would randomly (to the user) significantly affect query performance. I'd rather
> make a GUC turned off by default to store spans into the table instead of buffer.
>
> >3) I'm testing more complex queries. Most of my previous tests were using simple query protocol but extended protocol introduces
> >differences that break some assumptions I did. For example, with multi statement transaction like
> >BEGIN;
> >SELECT 1;
> >SELECT 2;
> >The parse of SELECT 2 will happen before the ExecutorEnd (and the end_tracing) of SELECT 1. For now, I'm skipping the post parse
> >hook if we still have an ongoing tracing.
>
> I've checked this behavior before and haven't noticed the case you mentioned, but for
> loops like
> for i in 1..2 loop
> StartTime := clock_timestamp();
> insert into t2 values (i, a_data);
> EndTime := clock_timestamp();
> Delta := 1000 * ( extract(epoch from EndTime) - extract(epoch from StartTime) );
> end loop;
>
> I've got the following call sequence:
> psql:/home/postgres/tests/trace.sql:52: NOTICE: pg_tracing_post_parse_analyze hook <1>
> psql:/home/postgres/tests/trace.sql:52: NOTICE: pg_tracing_planner_hook <1>
> psql:/home/postgres/tests/trace.sql:52: NOTICE: pg_tracing_post_parse_analyze hook <2>
> psql:/home/postgres/tests/trace.sql:52: NOTICE: pg_tracing_planner_hook <2>
> psql:/home/postgres/tests/trace.sql:52: NOTICE: pg_tracing_post_parse_analyze hook <StartTime := clock_timestamp()>
> psql:/home/postgres/tests/trace.sql:52: NOTICE: pg_tracing_planner_hook <StartTime := clock_timestamp()>
> psql:/home/postgres/tests/trace.sql:52: NOTICE: pg_tracing_post_parse_analyze hook <insert into t2 values (i, a_data)>
> psql:/home/postgres/tests/trace.sql:52: NOTICE: pg_tracing_planner_hook <insert into t2 values (i, a_data)>
> psql:/home/postgres/tests/trace.sql:52: NOTICE: pg_tracing_ExecutorStart <insert into t2 values (i, a_data)>
> psql:/home/postgres/tests/trace.sql:52: NOTICE: pg_tracing_ExecutorRun <insert into t2 values (i, a_data)>
> psql:/home/postgres/tests/trace.sql:52: NOTICE: pg_tracing_ExecutorFinish <insert into t2 values (i, a_data)>
> psql:/home/postgres/tests/trace.sql:52: NOTICE: pg_tracing_ExecutorEnd <insert into t2 values (i, a_data)>
> psql:/home/postgres/tests/trace.sql:52: NOTICE: pg_tracing_post_parse_analyze hook <EndTime := clock_timestamp()>
> psql:/home/postgres/tests/trace.sql:52: NOTICE: pg_tracing_planner_hook <EndTime := clock_timestamp()>
> psql:/home/postgres/tests/trace.sql:52: NOTICE: pg_tracing_post_parse_analyze hook <Delta := 1000 * ( extract(epoch from EndTime) - extract(epoch from StartTime) )>
> psql:/home/postgres/tests/trace.sql:52: NOTICE: pg_tracing_planner_hook <Delta := 1000 * ( extract(epoch from EndTime) - extract(epoch from StartTime) )>
> psql:/home/postgres/tests/trace.sql:52: NOTICE: pg_tracing_planner_hook <insert into t2 values (i, a_data)>
> psql:/home/postgres/tests/trace.sql:52: NOTICE: pg_tracing_ExecutorStart <insert into t2 values (i, a_data)>
> psql:/home/postgres/tests/trace.sql:52: NOTICE: pg_tracing_ExecutorRun <insert into t2 values (i, a_data)>
> psql:/home/postgres/tests/trace.sql:52: NOTICE: pg_tracing_ExecutorFinish <insert into t2 values (i, a_data)>
> psql:/home/postgres/tests/trace.sql:52: NOTICE: pg_tracing_ExecutorEnd <insert into t2 values (i, a_data)>
>
> --
> Regards,
> Nikita Malakhov
> Postgres Professional
> The Russian Postgres Company
> https://postgrespro.ru/
| Attachment | Content-Type | Size |
|---|---|---|
| subplan.png | image/png | 178.3 KB |
| pg_tracing_perf.svg | image/svg+xml | 631.1 KB |
| From | Date | Subject | |
|---|---|---|---|
| Next Message | Anthonin Bonnefoy | 2023-08-30 09:15:31 | Re: POC: Extension for adding distributed tracing - pg_tracing |
| Previous Message | Etsuro Fujita | 2023-08-30 09:07:59 | Re: Missing comments/docs about custom scan path |