| From: | Anthonin Bonnefoy <anthonin(dot)bonnefoy(at)datadoghq(dot)com> |
|---|---|
| To: | Nikita Malakhov <hukutoc(at)gmail(dot)com> |
| Cc: | Aleksander Alekseev <aleksander(at)timescale(dot)com>, PostgreSQL Hackers <pgsql-hackers(at)postgresql(dot)org> |
| Subject: | Re: POC: Extension for adding distributed tracing - pg_tracing |
| Date: | 2023-10-12 08:54:45 |
| Message-ID: | CAO6_XqpxOoRvQgZx+bxTR++8-YLJbqi2U00kH35=pTBUD067kg@mail.gmail.com |
| Views: | Whole Thread | Raw Message | Download mbox | Resend email |
| Thread: | |
| Lists: | pgsql-hackers |
Hi!
I've made a new batch of changes and improvements.
New features:
- Triggers are now correctly supported. They were not correctly
attached to the ExecutorFinish Span before.
- Additional configuration: exporting parameter values in span
metadata can be disabled. Deparsing can also be disabled now.
- Dbid and userid are now exported in span's metadata
- New Notify channel and threshold parameters. This channel will
receive a notification when the span buffer usage crosses the
threshold.
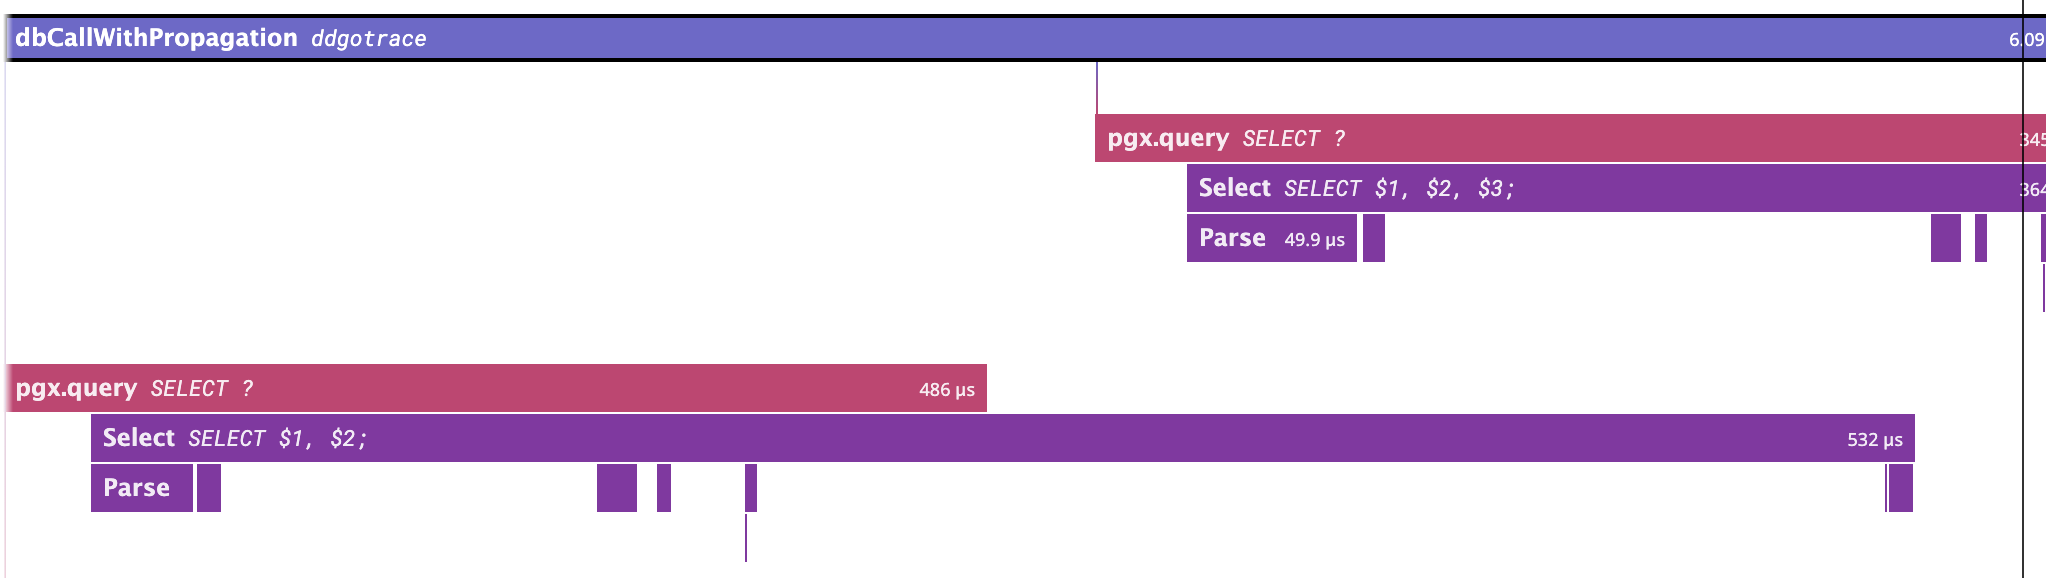
- Explicit transaction with extended protocol is now correctly
handled. This is done by keeping 2 different trace contexts, one for
parser/planner trace context at the root level and the other for
nested queries and executors. The spans now correctly show the parse
of the next statement happening before the ExecutorEnd of the previous
statement (see screenshot).
Changes:
- Parse span is now outside of the top span. When multiple statements
are processed, they are parsed together so it didn't make sense to
attach Parse to a specific statement.
- Deparse info is now exported in its own column. This will leave the
possibility to the trace forwarder to either use it as metadata or put
it in the span name.
- Renaming: Spans now have a span_type (Select, Executor, Parser...)
and a span_operation (ExecutorRun, Select $1...)
- For spans created without propagated trace context, the same traceid
will be used for statements within the same transaction.
- pg_tracing_consume_spans and pg_tracing_peek_spans are now
restricted to users with pg_read_all_stats role
- In instrument.h, instr->firsttime is only set if timer was requested
The code should be more stable from now on. Most of the features I had
planned are implemented.
I've also started writing the module's documentation. It's still a bit
bare but I will be working on completing this.
Regards,
Anthonin
On Fri, Sep 22, 2023 at 5:45 PM Anthonin Bonnefoy
<anthonin(dot)bonnefoy(at)datadoghq(dot)com> wrote:
>
> Hi!
>
> > If it's not too much trouble, please use `git format-patch`. This
> > makes applying and testing the patch much easier. Also you can provide
> > a commit message which 1. will simplify the work for the committer and
> > 2. can be reviewed as well.
> No problem, I will do that from now on.
>
> > The tests fail on CI [1]. I tried to run them locally and got the same
> > results.
> I've fixed the compilation issue, my working laptop is a mac so I've missed the
> linux errors. I've set up the CI on my side to avoid those issues in the future.
> I've also fixed most of the test issues.
> One test is still flaky: the parallel worker test can have one less
> worker reporting
> from time to time, I will try to find a way to make it more stable.
>
> > The comments for pg_tracing.c don't seem to be formatted properly.
> > Please make sure to run pg_indent. See src/tools/pgindent/README
> Done.
>
> > The interface pg_tracing_spans(true | false) doesn't strike me as
> > particularly readable. Maybe this function should be private and the
> > interface be like pg_tracing_spans() and pg_trancing_consume_spans().
> Agree. I wasn't super happy about the format. I've created
> pg_tracing_peek_spans() and pg_tracing_consume_spans() to make it
> more explicit.
>
> > Speaking of the tests I suggest adding a bit more comments before
> > every (or most) of the queries. Figuring out what they test could be
> > not particularly straightforward for somebody who will make changes
> > after the patch will be accepted.
> I've added more comments and a representation of the expected span
> hierarchy for the tests involving nested queries. It helps me a lot to keep
> track of the spans to check.
>
> I've done some additional changes:
> - I've added a start_ns to spans which is the nanosecond remainder of the
> time since the start of the trace. Since some spans can have a very short
> duration, some spans would have the same start if we use a microsecond
> precision. Having a start with a nanosecond precision allowed me to remove
> some hacks I was using and makes tests more stable.
> - I've also added a start_ns_time to span which is the value of the monotonic
> clock at the start of the span. I used to use duration_ns as a
> temporary storage
> for this value but it made things more confusing and hard to follow.
> - Fix error handling with nested queries created with ProcessUtility (like
> calling "create extension pg_tracing" twice).
>
> Regards,
> Anthonin
| Attachment | Content-Type | Size |
|---|---|---|
| pg-tracing-v8.patch | application/octet-stream | 305.3 KB |
| explicit_tx_extended_protocol.png | image/png | 80.5 KB |
| From | Date | Subject | |
|---|---|---|---|
| Next Message | Dagfinn Ilmari Mannsåker | 2023-10-12 09:27:34 | Re: Tab completion for AT TIME ZONE |
| Previous Message | David Rowley | 2023-10-12 08:20:36 | Re: Some performance degradation in REL_16 vs REL_15 |