Re: Add min and max execute statement time in pg_stat_statement
| From: | Marc Mamin <M(dot)Mamin(at)intershop(dot)de> |
|---|---|
| To: | "'KONDO Mitsumasa'" <kondo(dot)mitsumasa(at)lab(dot)ntt(dot)co(dot)jp>, Stephen Frost <sfrost(at)snowman(dot)net>, Dimitri Fontaine <dimitri(at)2ndQuadrant(dot)fr> |
| Cc: | Tom Lane <tgl(at)sss(dot)pgh(dot)pa(dot)us>, Andrew Dunstan <andrew(at)dunslane(dot)net>, "Peter Geoghegan" <pg(at)heroku(dot)com>, Robert Haas <robertmhaas(at)gmail(dot)com>, Gavin Flower <GavinFlower(at)archidevsys(dot)co(dot)nz>, PostgreSQL-development <pgsql-hackers(at)postgresql(dot)org> |
| Subject: | Re: Add min and max execute statement time in pg_stat_statement |
| Date: | 2013-10-23 21:34:30 |
| Message-ID: | B6F6FD62F2624C4C9916AC0175D56D880CE3DDA2@jenmbs01.ad.intershop.net |
| Views: | Whole Thread | Raw Message | Download mbox | Resend email |
| Thread: | |
| Lists: | pgsql-hackers |
>> Oscillating plan changes may fit multimodal but I don't feel that's
>> typical. My experience has been it's either an extremely rare plan
>> difference or it's a shift from one plan to another over time.
>After all, all of avg, min, max and stdev are only numerical value for predicting model. There aren't the robustness and strictness such as Write Ahead Logging. It resembles a weather forecast. They are still better than nothing.
>It is needed a human judgment to finally suppose a cause from the numerical values. By the way, we can guess probability of the value from stdev.
>Therefore we can guess easily even if there is an extreme value in min/max whether it is normal or not.
>>> What I've been gathering from my quick chat this morning is that
>>> either you know how to characterize the distribution and then the min
>>> max and average are useful on their own, or you need to keep track of
>>> an histogram where all the bins are of the same size to be able to
>>> learn what the distribution actually is.
Hello,
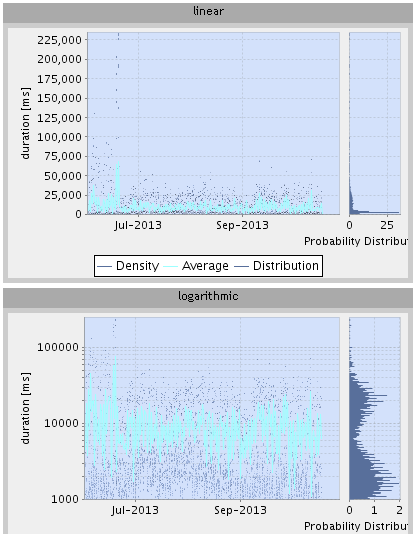
We have an in house reporting application doing a lot of response times graphing.
Our experience has shown that in many cases of interest (the one you want to dig in)
a logarithmic scale for histogram bins result in a better visualization.
attached an example from a problematic postgres query...
my 2 pences,
Marc Mamin
| Attachment | Content-Type | Size |
|---|---|---|
|
image/png | 57.4 KB |
In response to
- Re: Add min and max execute statement time in pg_stat_statement at 2013-10-23 02:19:07 from KONDO Mitsumasa
Responses
- Re: Add min and max execute statement time in pg_stat_statement at 2013-10-23 21:57:18 from Gavin Flower
Browse pgsql-hackers by date
| From | Date | Subject | |
|---|---|---|---|
| Next Message | Martijn van Oosterhout | 2013-10-23 21:46:01 | Re: Add min and max execute statement time in pg_stat_statement |
| Previous Message | Peter Geoghegan | 2013-10-23 20:26:15 | Re: Add min and max execute statement time in pg_stat_statement |