Re: checkpointer continuous flushing - V16
| From: | Tomas Vondra <tomas(dot)vondra(at)2ndquadrant(dot)com> |
|---|---|
| To: | pgsql-hackers(at)postgresql(dot)org |
| Subject: | Re: checkpointer continuous flushing - V16 |
| Date: | 2016-03-01 15:06:47 |
| Message-ID: | 56D5B007.7000801@2ndquadrant.com |
| Views: | Whole Thread | Raw Message | Download mbox | Resend email |
| Thread: | |
| Lists: | pgsql-hackers |
Hi,
On 02/18/2016 11:31 AM, Andres Freund wrote:
> On 2016-02-11 19:44:25 +0100, Andres Freund wrote:
>> The first two commits of the series are pretty close to being ready. I'd
>> welcome review of those, and I plan to commit them independently of the
>> rest as they're beneficial independently. The most important bits are
>> the comments and docs of 0002 - they weren't particularly good
>> beforehand, so I had to rewrite a fair bit.
>>
>> 0001: Make SetHintBit() a bit more aggressive, afaics that fixes all the
>> potential regressions of 0002
>> 0002: Fix the overaggressive flushing by the wal writer, by only
>> flushing every wal_writer_delay ms or wal_writer_flush_after
>> bytes.
>
> I've pushed these after some more polishing, now working on the next
> two.
I've finally had time to do some benchmarks on those two (already
committed) pieces. I've promised to do more testing while discussing the
patches with Andres some time ago, so here we go.
I do have two machines I use for this kind of benchmarks
1) HP DL380 G5 (old rack server)
- 2x Xeon E5450, 16GB RAM (8 cores)
- 4x 10k SAS drives in RAID-10 on H400 controller (with BBWC)
- RedHat 6
- shared_buffers = 4GB
- min_wal_size = 2GB
- max_wal_size = 6GB
2) workstation with i5 CPU
- 1x i5-2500k, 8GB RAM
- 6x Intel S3700 100GB (in RAID0 for this benchmark)
- Gentoo
- shared_buffers = 2GB
- min_wal_size = 1GB
- max_wal_size = 8GB
Both machines were using the same kernel version 4.4.2 and default io
scheduler (cfq). The
The test procedure was quite simple - pgbench with three different
scales, for each scale three runs, 1h per run (and 30 minutes of warmup
before each run).
Due to the difference in amount of RAM, each machine used different
scales - the goal is to have small, ~50% RAM, >200% RAM sizes:
1) Xeon: 100, 400, 6000
2) i5: 50, 200, 3000
The commits actually tested are
cfafd8be (right before the first patch)
7975c5e0 Allow the WAL writer to flush WAL at a reduced rate.
db76b1ef Allow SetHintBits() to succeed if the buffer's LSN ...
For the Xeon, the total tps for each run looks like this:
scale commit 1 2 3
----------------------------------------------------
100 cfafd8be 5136 5132 5144
7975c5e0 5172 5148 5164
db76b1ef 5131 5139 5131
400 cfafd8be 3049 3042 2880
7975c5e0 3038 3026 3027
db76b1ef 2946 2940 2933
6000 cfafd8be 394 389 391
7975c5e0 391 479 467
db76b1ef 443 416 481
So I'd say not much difference, except for the largest data set where
the improvement is visible (although it's a bit too noisy and additional
runs would be useful).
On the i5 workstation with SSDs, the results look like this:
scale commit 1 2 3
------------------------------------------------
50 cfafd8be 5478 5486 5485
7975c5e0 5473 5468 5436
db76b1ef 5484 5453 5452
200 cfafd8be 5169 5176 5167
7975c5e0 5144 5151 5148
db76b1ef 5162 5131 5131
3000 cfafd8be 2392 2367 2359
7975c5e0 2301 2340 2347
db76b1ef 2277 2348 2342
So pretty much no difference, or perhaps maybe a slight slowdown.
One of the goals of this thread (as I understand it) was to make the
overall behavior smoother - eliminate sudden drops in transaction rate
due to bursts of random I/O etc.
One way to look at this is in terms of how much the tps fluctuates, so
let's see some charts. I've collected per-second tps measurements (using
the aggregation built into pgbench) but looking at that directly is
pretty pointless because it's very difficult to compare two noisy lines
jumping up and down.
So instead let's see CDF of the per-second tps measurements. I.e. we
have 3600 tps measurements, and given a tps value the question is what
percentage of the measurements is below this value.
y = Probability(tps <= x)
We prefer higher values, and the ideal behavior would be that we get
exactly the same tps every second. Thus an ideal CDF line would be a
step line. Of course, that's rarely the case in practice. But comparing
two CDF curves is easy - the line more to the right is better, at least
for tps measurements, where we prefer higher values.
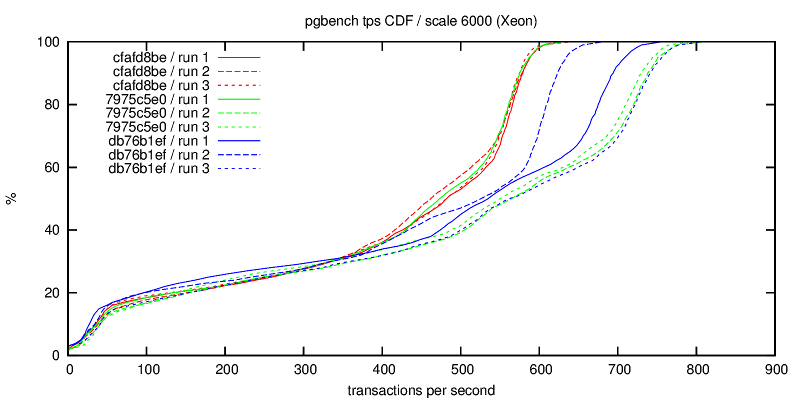
1) tps-xeon.png
The original behavior (red lines) is quite consistent. The two patches
generally seem to improve the performance, although sadly it seems that
the variability of the performance actually increased quite a bit, as
the CDFs are much wider (but generally to the right of the old ones).
I'm not sure what exactly causes the volatility.
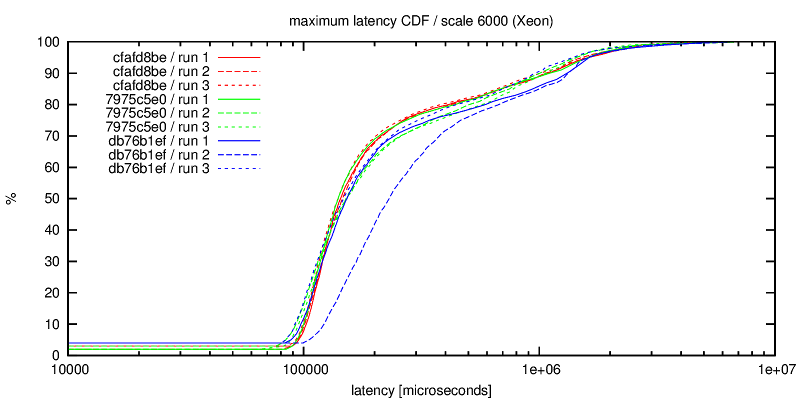
2) maxlat-xeon.png
Another view at the per-second data, this time using "max latency" from
the pgbench aggregated log. Of course, this time "lower is better" so
we'd like to move the CDF to the left (to get lower max latencies).
Sadly, it changes is mostly the other direction, i.e. the max latency
slightly increases (but the differences are not as significant as for
the tps rate, discussed in the previous paragraph). But apparently the
average latency actually improves (which gives us better tps).
Note: In this chart, x-axis is logarithmic.
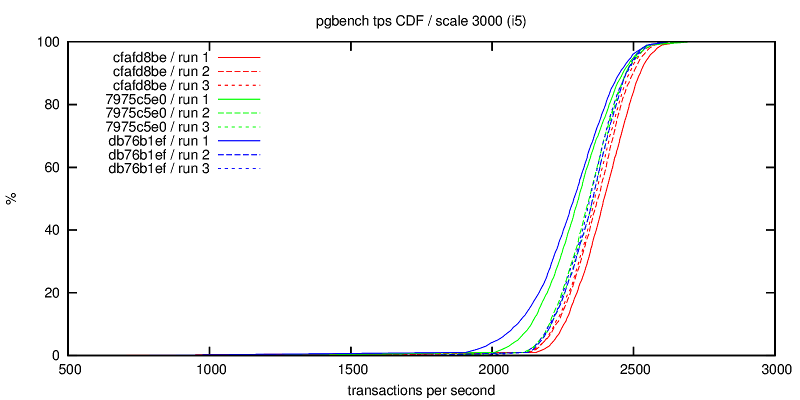
3) tps-i5.png
Same chart with CDF of tps, but for the i5 workstation. This actually
shows the consistent slowdown due to the two patches, the tps
consistently shifts to the lower end (~2000tps).
I do have some more data, but those are the most interesting charts. The
rest usually shows about the same thing (or nothing).
Overall, I'm not quite sure the patches actually achieve the intended
goals. On the 10k SAS drives I got better performance, but apparently
much more variable behavior. On SSDs, I get a bit worse results.
Also, I really wonder what will happen with non-default io schedulers. I
believe all the testing so far was done with cfq, so what happens on
machines that use e.g. "deadline" (as many DB machines actually do)?
regards
--
Tomas Vondra http://www.2ndQuadrant.com
PostgreSQL Development, 24x7 Support, Remote DBA, Training & Services
| Attachment | Content-Type | Size |
|---|---|---|
|
image/png | 47.8 KB |
|
image/png | 50.1 KB |
|
image/png | 43.2 KB |
In response to
- Re: checkpointer continuous flushing - V16 at 2016-02-18 10:31:08 from Andres Freund
Responses
- Re: checkpointer continuous flushing - V16 at 2016-03-01 15:51:13 from Fabien COELHO
- Re: checkpointer continuous flushing - V16 at 2016-03-07 17:41:51 from Andres Freund
Browse pgsql-hackers by date
| From | Date | Subject | |
|---|---|---|---|
| Next Message | Teodor Sigaev | 2016-03-01 15:09:16 | Re: WIP: Upper planner pathification |
| Previous Message | Alexander Korotkov | 2016-03-01 15:06:37 | Re: PoC: Partial sort |