Re: Default setting for enable_hashagg_disk
| From: | Tomas Vondra <tomas(dot)vondra(at)2ndquadrant(dot)com> |
|---|---|
| To: | Tom Lane <tgl(at)sss(dot)pgh(dot)pa(dot)us> |
| Cc: | Jeff Davis <pgsql(at)j-davis(dot)com>, Peter Geoghegan <pg(at)bowt(dot)ie>, Alvaro Herrera <alvherre(at)2ndquadrant(dot)com>, David Rowley <dgrowleyml(at)gmail(dot)com>, Stephen Frost <sfrost(at)snowman(dot)net>, Andres Freund <andres(at)anarazel(dot)de>, Bruce Momjian <bruce(at)momjian(dot)us>, Robert Haas <robertmhaas(at)gmail(dot)com>, Justin Pryzby <pryzby(at)telsasoft(dot)com>, Melanie Plageman <melanieplageman(at)gmail(dot)com>, "pgsql-hackers(at)postgresql(dot)org" <pgsql-hackers(at)postgresql(dot)org> |
| Subject: | Re: Default setting for enable_hashagg_disk |
| Date: | 2020-07-24 01:22:48 |
| Message-ID: | 20200724012248.y77rpqc73agrsvb3@development |
| Views: | Whole Thread | Raw Message | Download mbox | Resend email |
| Thread: | |
| Lists: | pgsql-docs pgsql-hackers |
On Mon, Jul 20, 2020 at 07:25:39PM +0200, Tomas Vondra wrote:
>On Mon, Jul 20, 2020 at 09:17:21AM -0400, Tom Lane wrote:
>>Tomas Vondra <tomas(dot)vondra(at)2ndquadrant(dot)com> writes:
>>>There's a minor problem here, though - these stats were collected before
>>>we fixed the tlist issue, so hashagg was spilling about 10x the amount
>>>of data compared to sort+groupagg. So maybe that's the first thing we
>>>should do, before contemplating changes to the costing - collecting
>>>fresh data. I can do that, if needed.
>>
>>+1. I'm not sure if we still need to do anything, but we definitely
>>can't tell on the basis of data that doesn't reliably reflect what
>>the code does now.
>>
>
>OK, will do. The hardware is busy doing something else at the moment,
>but I'll do the tests and report results in a couple days.
>
Hi,
So let me share some fresh I/O statistics collected on the current code
using iosnoop. I've done the tests on two different machines using the
"aggregate part" of TPC-H Q17, i.e. essentially this:
SELECT * FROM (
SELECT
l_partkey AS agg_partkey,
0.2 * avg(l_quantity) AS avg_quantity
FROM lineitem GROUP BY l_partkey OFFSET 1000000000
) part_agg;
The OFFSET is there just to ensure we don't need to send anything to
the client, etc.
On the first machine (i5-2500k, 8GB RAM) data was located on a RAID
of SSD devices, and the temp tablespace was placed on a separate SSD
device. This makes it easy to isolate the I/O requests related to the
spilling, which is the interesting thing. The data set here is scale
32GB, most of it in the lineitem table.
On the second machine (xeon e5-2620, 64GB RAM) was using scale 75GB,
and I've done two different tests. First, the data was on a SATA RAID
while the temp tablespace was on a NVMe SSD - this allows isolating
the I/O requests just like on the first machine, but the durations are
not very interesting because the SATA RAID is the bottleneck. Then I've
switched the locations (data on SSD, temp files on SATA RAID), which
gives us some interesting query durations but the multiple devices make
it difficult to analyze the I/O patterns. So I'll present patterns from
the first setup and timings from the second one, hopefully it's not
completely bogus.
In all cases I've ran the query with a range of work_mem values and
enable_sort/enable_hashagg settings, and enabled/disabled parallelism,
collecting the iosnoop data, query durations, information about cost
and disk usage. Attached are the explain plans, summary of iosnoop
stats etc.
I also have a couple observations about hashagg vs. groupagg, and the
recent hashagg fixes.
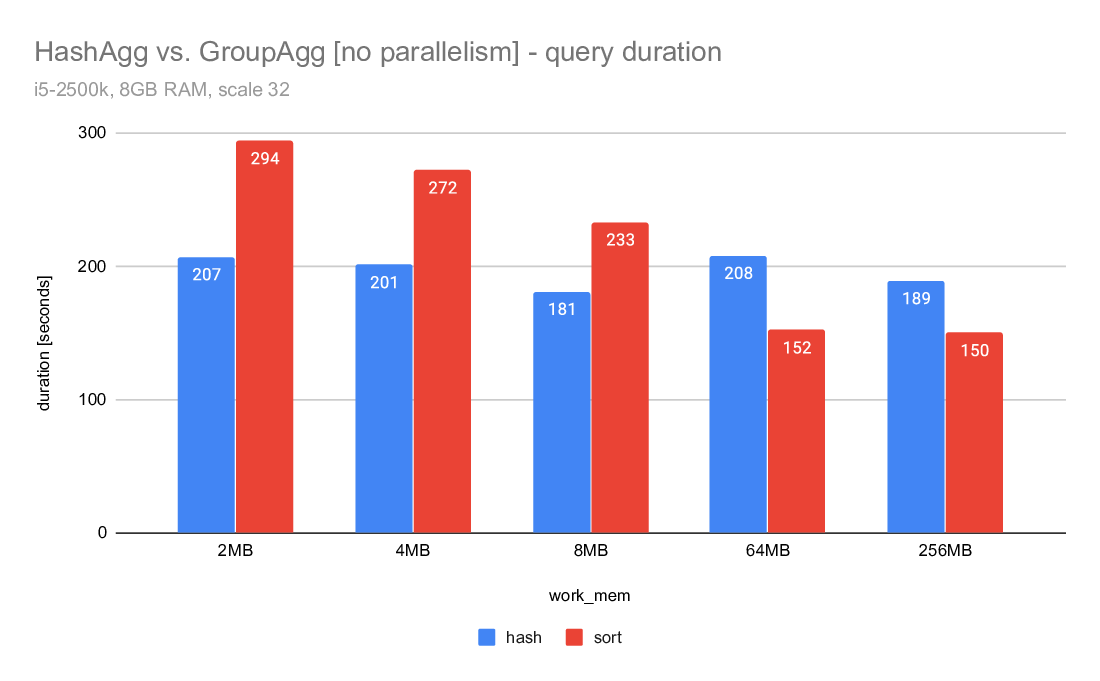
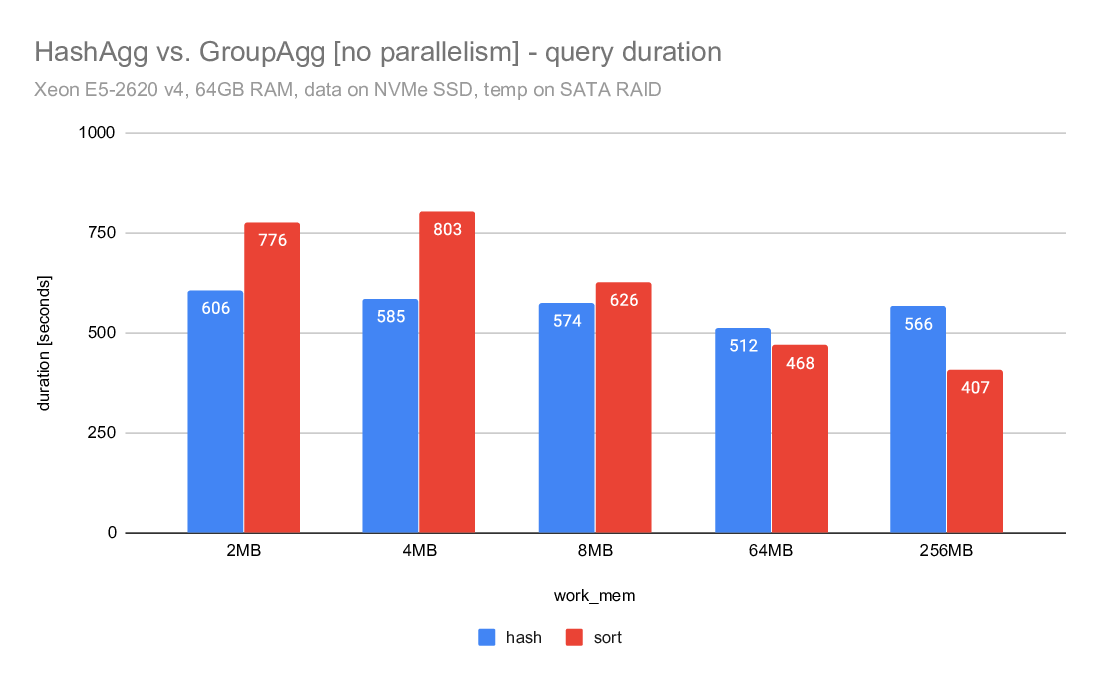
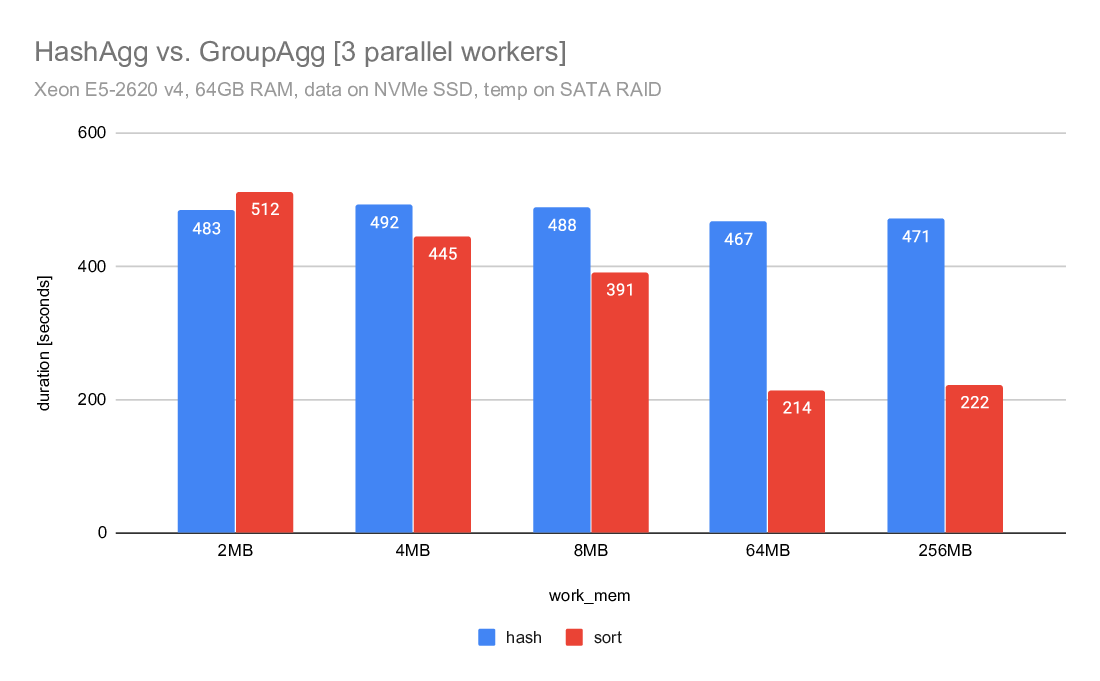
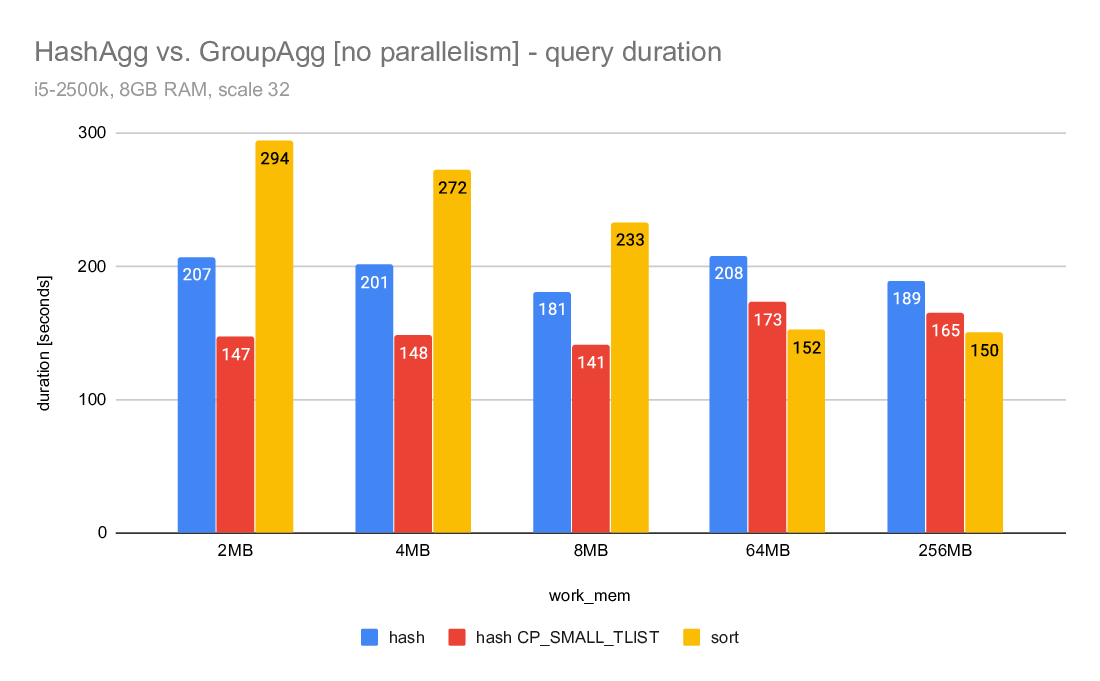
1) hashagg vs. groupagg
If you look at the query duration charts comparing hashagg and groupagg,
you can see that in both cases the hashagg is stable and mostly not
dependent on work_mem. It initially (for low work_mem values) wins, but
the sort+groupagg gradually improves and eventually gets faster.
Note: This does not include work_mem large enough to eliminate the need
for spilling, which would probably make hashagg much faster.
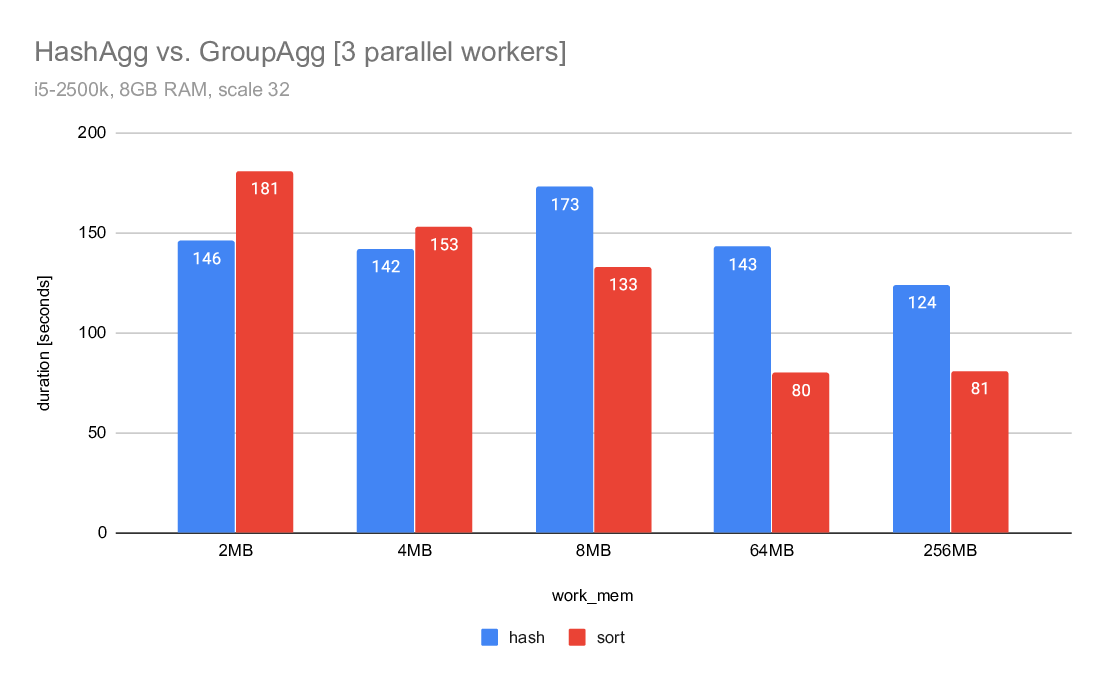
For the parallel case the difference is much smaller and groupagg gets
faster much sooner. This is probably due to the large number of groups
in this particular data set.
Now, the I/O patterns - if you look into the iosnoop summaries, there
are two tables for each config - block stats (request sizes) and delta
stats (gaps between requests). These tables need to be interpreted in
combination - ideally, the blocks should be larger and the gaps should
match the block size.
IIRC it was suggested hashagg does more random I/O than sort, but I
don't think the iosnoop data really show that - in fact, the requests
tend to be larger than for sort, and the deltas match the request sizes
better I think. At least for lower work_mem values. With larger values
it kinda inverts and sort gets more sequential, but I don't think the
difference is very big.
Also, had it been more random it'd be very obvious from durations with
temp tablespace on the SATA RAID, I think.
So I'm not sure we need to tweak the hashagg costing for this reason.
2) hashagg vs. CP_SMALL_TLIST vs. groupagg
I was a bit puzzled because the hashagg timings seemed higher compared
to the last runs with the CP_SMALL_TLIST fix (which was now reverted
and replaced by projection right before spilling). But the explanation
is pretty simple - we spill significantly more data than with the
CP_SMALL_TLIST patch. And what's also interesting is that in both cases
we spill much more data than sort.
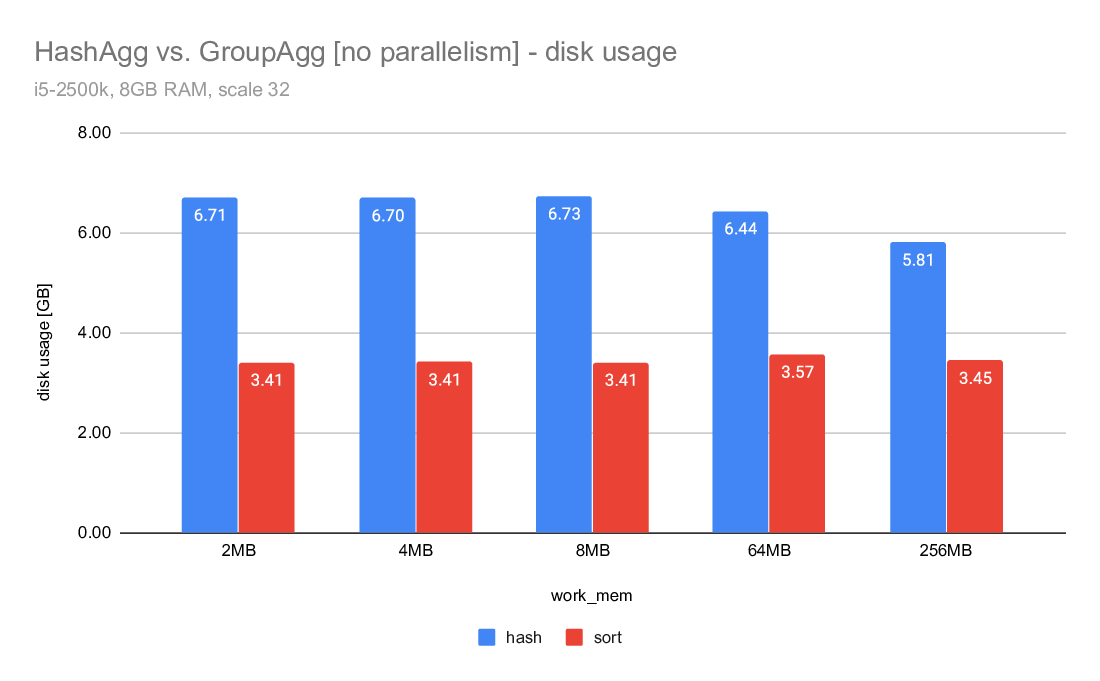
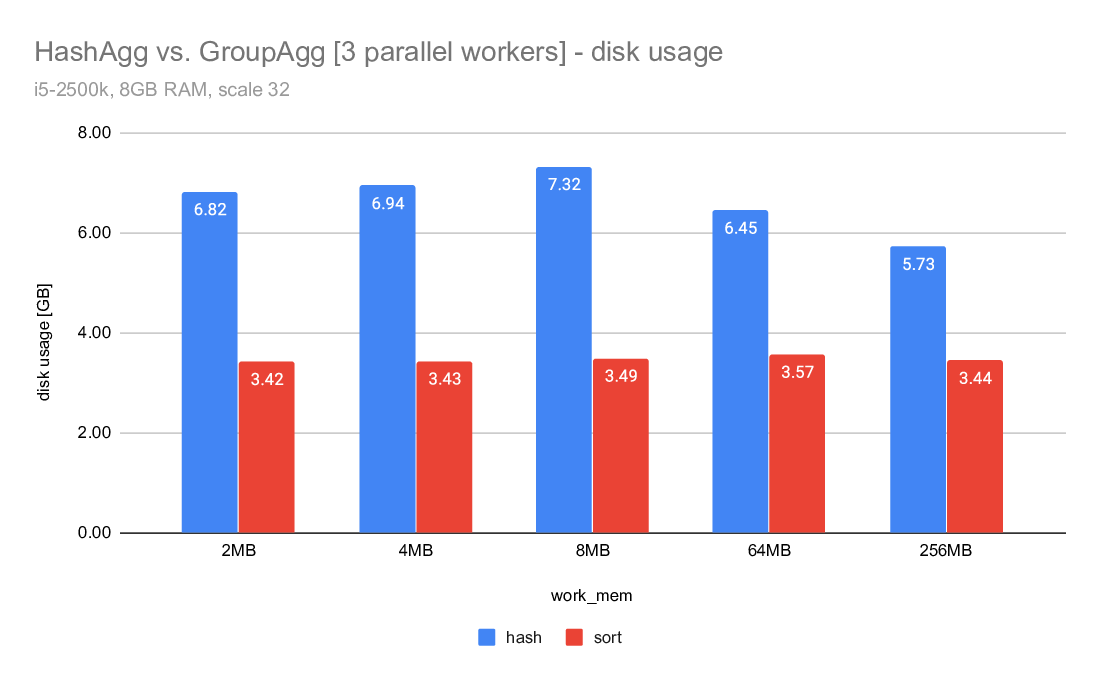
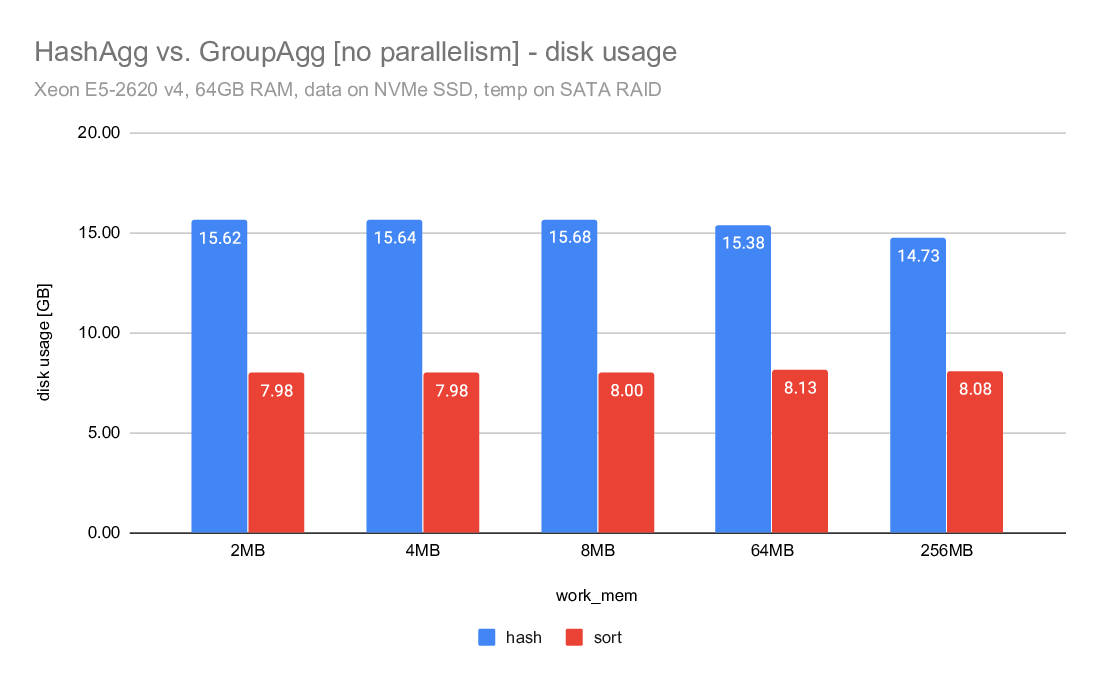
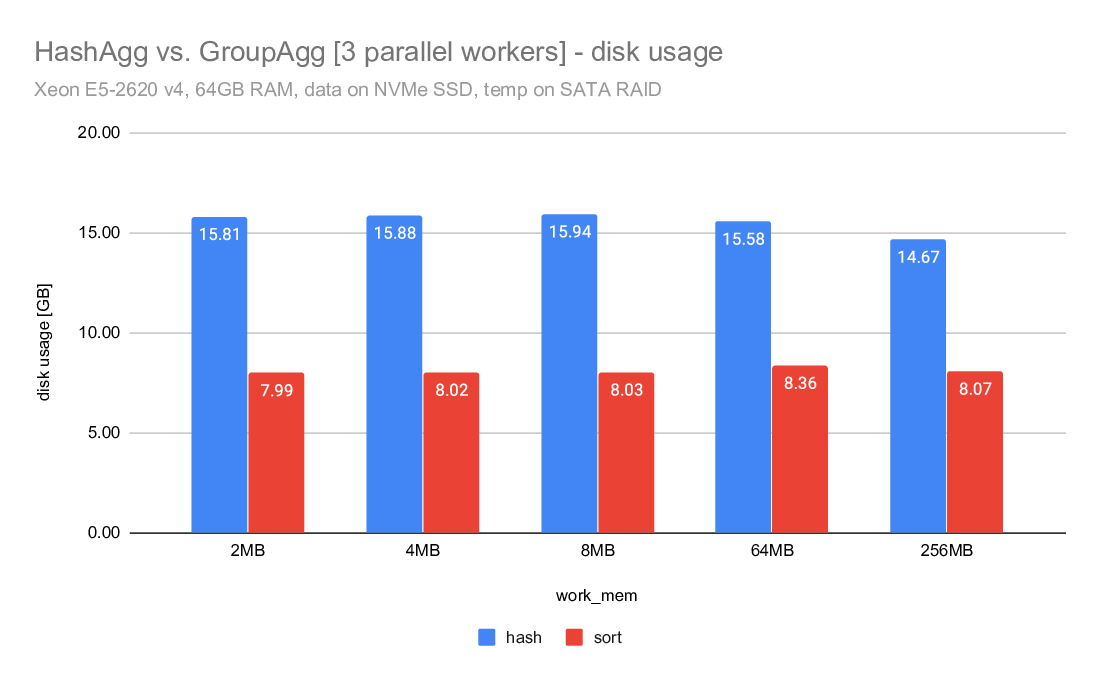
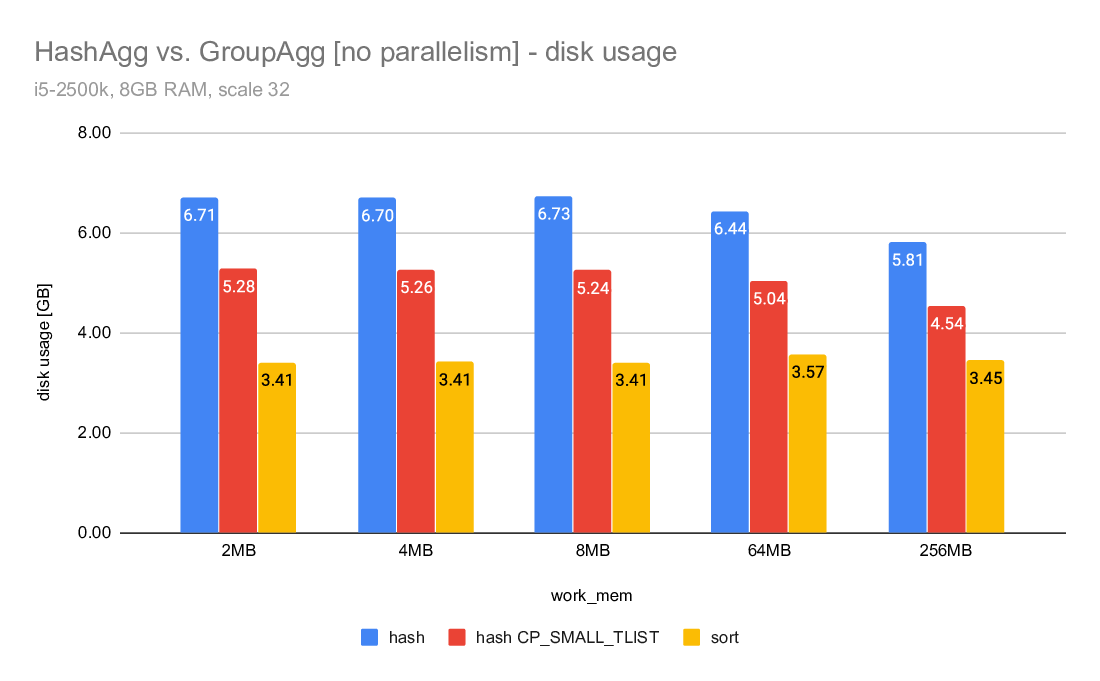
This is illustrated on the "disk usage" charts, but let me show some
numbers here. These are the "Disk Usage" values from explain analyze
(measured in GB):
2MB 4MB 8MB 64MB 256MB
-----------------------------------------------------------
hash 6.71 6.70 6.73 6.44 5.81
hash CP_SMALL_TLIST 5.28 5.26 5.24 5.04 4.54
sort 3.41 3.41 3.41 3.57 3.45
So sort writes ~3.4GB of data, give or take. But hashagg/master writes
almost 6-7GB of data, i.e. almost twice as much. Meanwhile, with the
original CP_SMALL_TLIST we'd write "only" ~5GB of data. That's still
much more than the 3.4GB of data written by sort (which has to spill
everything, while hashagg only spills rows not covered by the groups
that fit into work_mem).
I initially assumed this is due to writing the hash value to the tapes,
and the rows are fairly narrow (only about 40B per row), so a 4B hash
could make a difference - but certainly not this much. Moreover, that
does not explain the difference between master and the now-reverted
CP_SMALL_TLIST, I think.
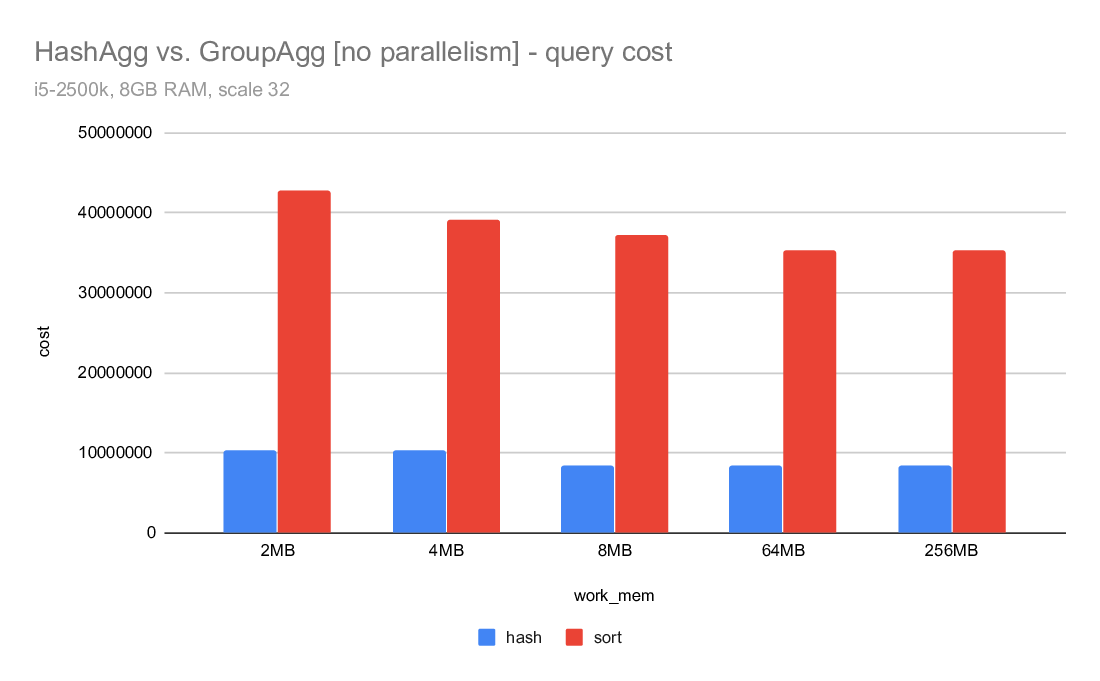
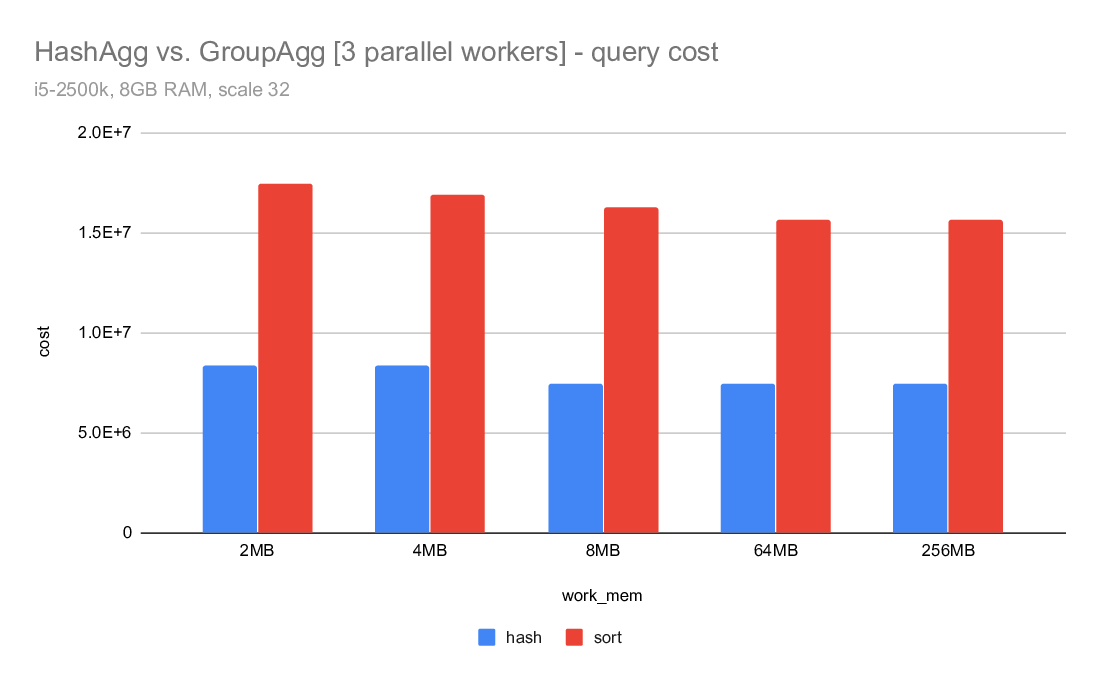
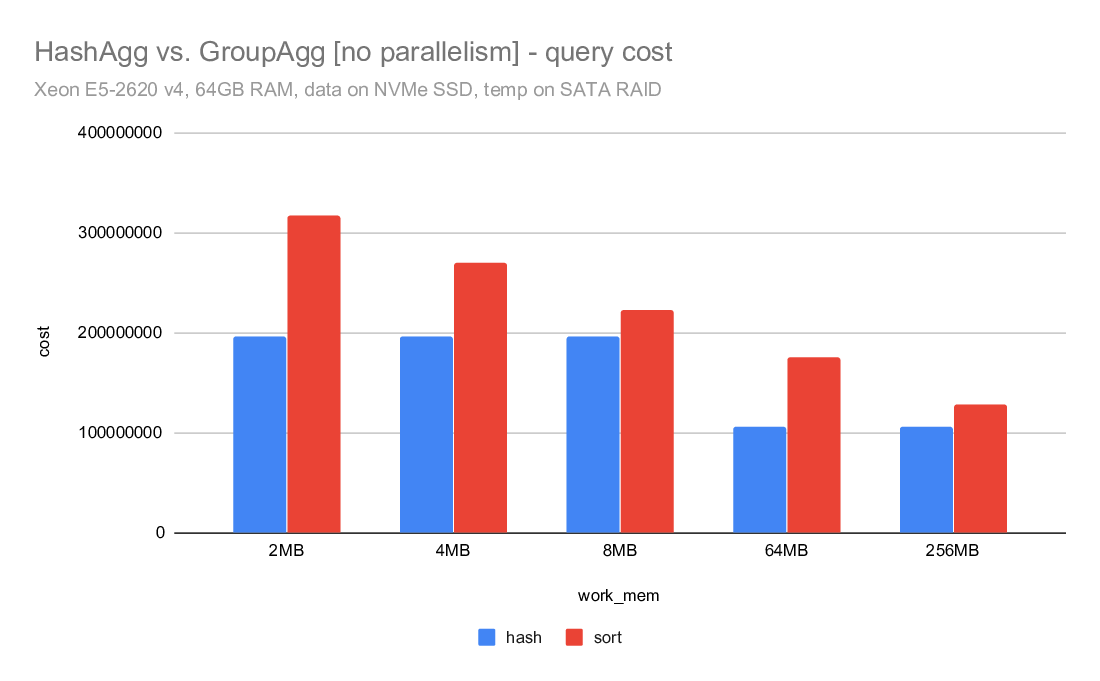
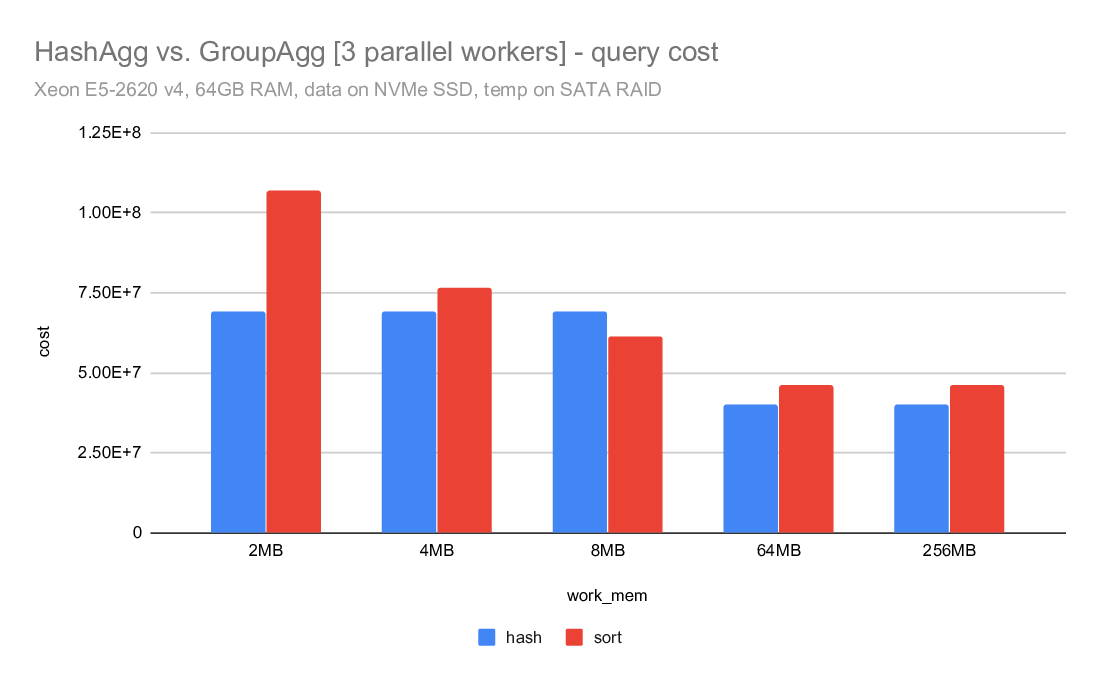
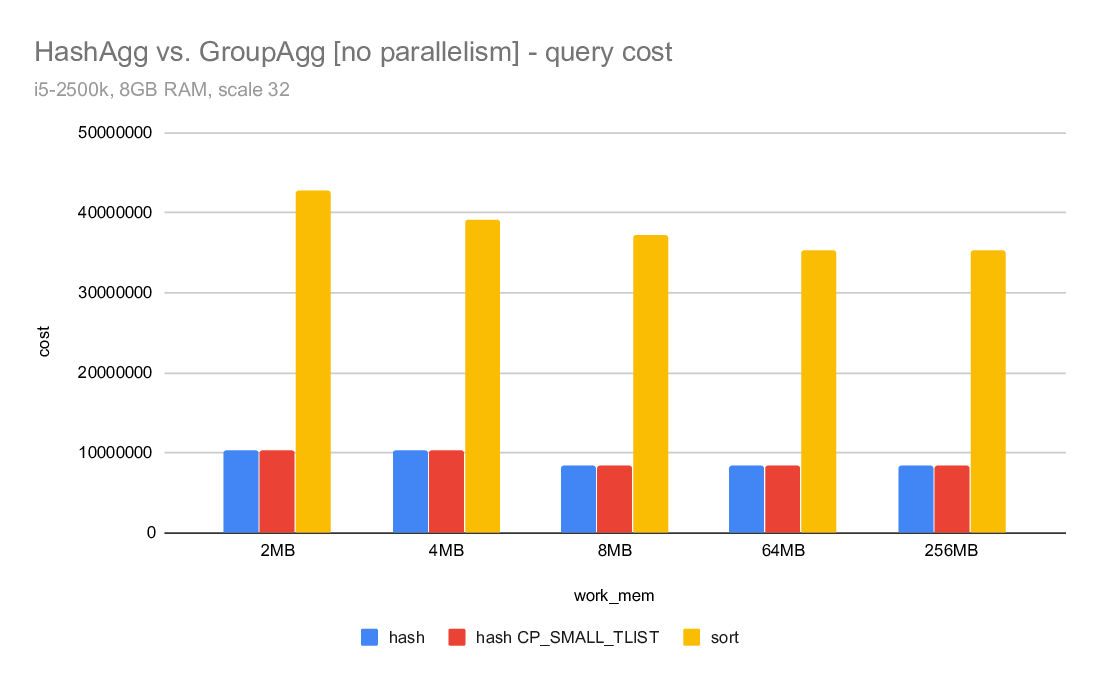
3) costing
What I find really surprising is the costing - despite writing about
twice as much data, the hashagg cost is estimated to be much lower than
the sort. For example on the i5 machine, the hashagg cost is ~10M, while
sort cost is almost 42M. Despite using almost twice as much disk. And
the costing is exactly the same for master and the CP_SMALL_TLIST.
I was wondering if this might be due to random_page_cost being too low
or something, but I very much doubt that. Firstly - this is on SSDs,
so I really don't want it very high. Secondly, increasing random_page
cost actually increases both costs.
So I'm wondering why the hashagg cost is so low, but I haven't looked
into that yet.
regards
--
Tomas Vondra http://www.2ndQuadrant.com
PostgreSQL Development, 24x7 Support, Remote DBA, Training & Services
| Attachment | Content-Type | Size |
|---|---|---|
| xeon-temp-on-ssd.tgz | application/gzip | 8.4 KB |
| xeon-temp-on-sata.tgz | application/gzip | 5.2 KB |
| i5.tgz | application/gzip | 5.2 KB |
| iosnoop-xeon.txt | text/plain | 32.2 KB |
| iosnoop-i5.txt | text/plain | 28.5 KB |
|
image/png | 17.8 KB |
|
image/png | 15.6 KB |
|
image/png | 17.4 KB |
|
image/png | 17.2 KB |
|
image/png | 16.0 KB |
|
image/png | 18.1 KB |
|
image/png | 19.3 KB |
|
image/png | 15.3 KB |
|
image/png | 19.0 KB |
|
image/png | 18.4 KB |
|
image/png | 16.8 KB |
|
image/png | 19.5 KB |
|
image/png | 19.0 KB |
|
image/png | 16.5 KB |
|
image/png | 19.4 KB |
In response to
- Re: Default setting for enable_hashagg_disk at 2020-07-20 17:25:39 from Tomas Vondra
Responses
- Re: Default setting for enable_hashagg_disk at 2020-07-24 02:33:45 from Peter Geoghegan
- Re: Default setting for enable_hashagg_disk at 2020-07-24 15:18:48 from Robert Haas
Browse pgsql-docs by date
| From | Date | Subject | |
|---|---|---|---|
| Next Message | Peter Geoghegan | 2020-07-24 02:33:45 | Re: Default setting for enable_hashagg_disk |
| Previous Message | Peter Geoghegan | 2020-07-23 23:32:07 | Re: Default setting for enable_hashagg_disk |
Browse pgsql-hackers by date
| From | Date | Subject | |
|---|---|---|---|
| Next Message | Andres Freund | 2020-07-24 02:04:02 | Re: [Patch] ALTER SYSTEM READ ONLY |
| Previous Message | Andres Freund | 2020-07-24 01:17:07 | Re: [PATCH] audo-detect and use -moutline-atomics compilation flag for aarch64 |