| From: | "Anton A(dot) Melnikov" <a(dot)melnikov(at)postgrespro(dot)ru> |
|---|---|
| To: | Andres Freund <andres(at)anarazel(dot)de>, Tom Lane <tgl(at)sss(dot)pgh(dot)pa(dot)us> |
| Cc: | "pgsql-hackers(at)postgresql(dot)org" <pgsql-hackers(at)postgresql(dot)org>, David Rowley <dgrowleyml(at)gmail(dot)com>, Michael Paquier <michael(at)paquier(dot)xyz>, iamqyh(at)gmail(dot)com |
| Subject: | Re: Some performance degradation in REL_16 vs REL_15 |
| Date: | 2023-12-26 04:38:58 |
| Message-ID: | 1d3a7d8f-cb7c-4468-a578-d8a1194ea2de@postgrespro.ru |
| Views: | Whole Thread | Raw Message | Download mbox | Resend email |
| Thread: | |
| Lists: | pgsql-hackers |
Hi!
Thank you very much for pointing out these important moments:
"NUMA" effects:
On 15.11.2023 18:09, Tom Lane wrote:
> NUMA creates huge reproducibility
> problems too on multisocket machines (which your server is IIUC).
> When I had a multisocket workstation I'd usually bind all the server
> processes to one socket if I wanted more-or-less-repeatable numbers.
>
"frequency" effects:
On 15.11.2023 21:04, Andres Freund wrote:
>
> One very common reason for symptoms like this are power-saving measures by the
> CPU. In workloads where the CPU is not meaningfully utilized, the CPU will go
> into a powersaving mode - which can cause workloads that are latency sensitive
> to be badly affected. Both because initially the cpu will just work at a
> lower frequency and because it takes time to shift to a higher latency.
> To get back to your benchmark: Because you're measuring a highly contended
> system, where most of the time postgres will just wait for
> a) row-level locks to be released
> b) WAL writes to finish (you're clearly not using a very fast disk)
> the CPU would have plenty time to clock down.
And "huge page" effect:
On 15.11.2023 23:21, Andres Freund wrote:
> The really annoying thing about this is that entirely unpredictable whether
> huge pages are used or not. Building the same way, sometimes 0, sometimes 2MB,
> sometimes 6MB are mapped huge. Even though the on-disk contents are
> precisely the same. And it can even change without rebuilding, if the
> binary is evicted from the page cache.
As for "NUMA" and "frequency" effects the following steps were made.
As directed by Andres i really found that CPU cores sometimes were falling down in low-frequency
states during the test. See server-C1-C1E-falls.mkv attached.
Additionally, with my colleague Andrew Bille [<andrewbille(at)gmail(dot)com>]
we found an interesting thing.
We disabled software performance management in the server BIOS
and completely prohibited C-states here. But still,
the processor cores sometimes fell to C1 and C1E with a frequency decrease.
So we set back the software management in the BIOS and an additional command
echo <scaling_max_freq> | sudo tee /sys/devices/system/cpu/cpu*/cpufreq/scaling_min_freq
solved this problem. The server cores began to operate at a fixed
frequency as shown in: server-stable-freq.mkv
And a similar result was obtained on my pc: mypc-stable-freq.mkv
Then i brought the server and my pc hardware configuration as close as possible to each other.
There are eight real cores on my pc without hyperthreading. On the other hand there are
only six real cores in every cpu on the server. So it is impossible to obtain 8 real cores on single cpu here.
To align both configurations i disable two of the 8 cores on my pc with numactl. On the server the second cpu was also disabled
through numactl while the hyperthreading was disabled in the BIOS.
Finally we got a similar configuration of single six-core processor both on the server and on my pc.
Full set of the configuration commands for server was like that:
numactl --cpunodebind=0 --membind=0 --physcpubind=1,3,5,7,9,11 bash
sudo cpupower frequency-set -g performance
sudo cpupower idle-set -D0
echo 3059000 | sudo tee /sys/devices/system/cpu/cpu*/cpufreq/scaling_min_freq
(Turbo Boost was disabled in BIOS.)
And for my pc like that:
numactl --cpunodebind=0 --membind=0 --physcpubind=0,1,2,3,4,5 bash
sudo cpupower frequency-set -g performance
sudo cpupower idle-set -D0
echo 2000000 | sudo tee /sys/devices/system/cpu/cpu*/cpufreq/scaling_min_freq
echo 0 | sudo tee /sys/devices/system/cpu/cpufreq/boost
There are the numactl and cpupower output after configuration in
server-hw.txt and mypc-hw.txt respectively.
To eliminate the "huge page" effect i use huge_pages = off
in the all further differential measurements.
As for the other effects that Andres mentioned: dips due to bgwriter, autovacuum,
kernel pagecache effects and other possible noise,
i minimize the effect of them statistically using the following measurement sequence.
One series of such a measurement consists of:
1) Remove install and data dirs;
2) Fully reconfigure, rebuild and reinstall server;
3) Reinit new db;
4) Launch pgbench for 20 seconds in a loop with intermediate checkpoints, as you advised.
A few tens measurements totally.
5) Sort the results and remove points with considerable (more than 1%) deviation from tails.
The algorithm was as follows:
if the fist or last point deviates from the average by more than 1% remove it;
recalculate the average value;
repeat from the begin.
Removed points marked with "x" in the raw data files raw-server.txt and raw-myPC.txt.
6) Get a result series of TPS data and average (expected) value
7) Calculate the standard deviation (error)
Each series takes approximately 20 minutes.
The general order of measurements was as follows:
1) Compare REL_10_STABLE vs REL_16_STABLE on my pc and take difference1 in TPS;
2) Compare REL_10_STABLE vs REL_16_STABLE at the same commits on server and take the difference2;
3) Compare difference1 and difference2 with each other.
In my first attempt i got exactly the opposite results. On my pc REL_10 was noticeably
faster than REL_16 while on the server the latter wins.
After repeating measurements using the updated configurations and methods described above
i got the following results:
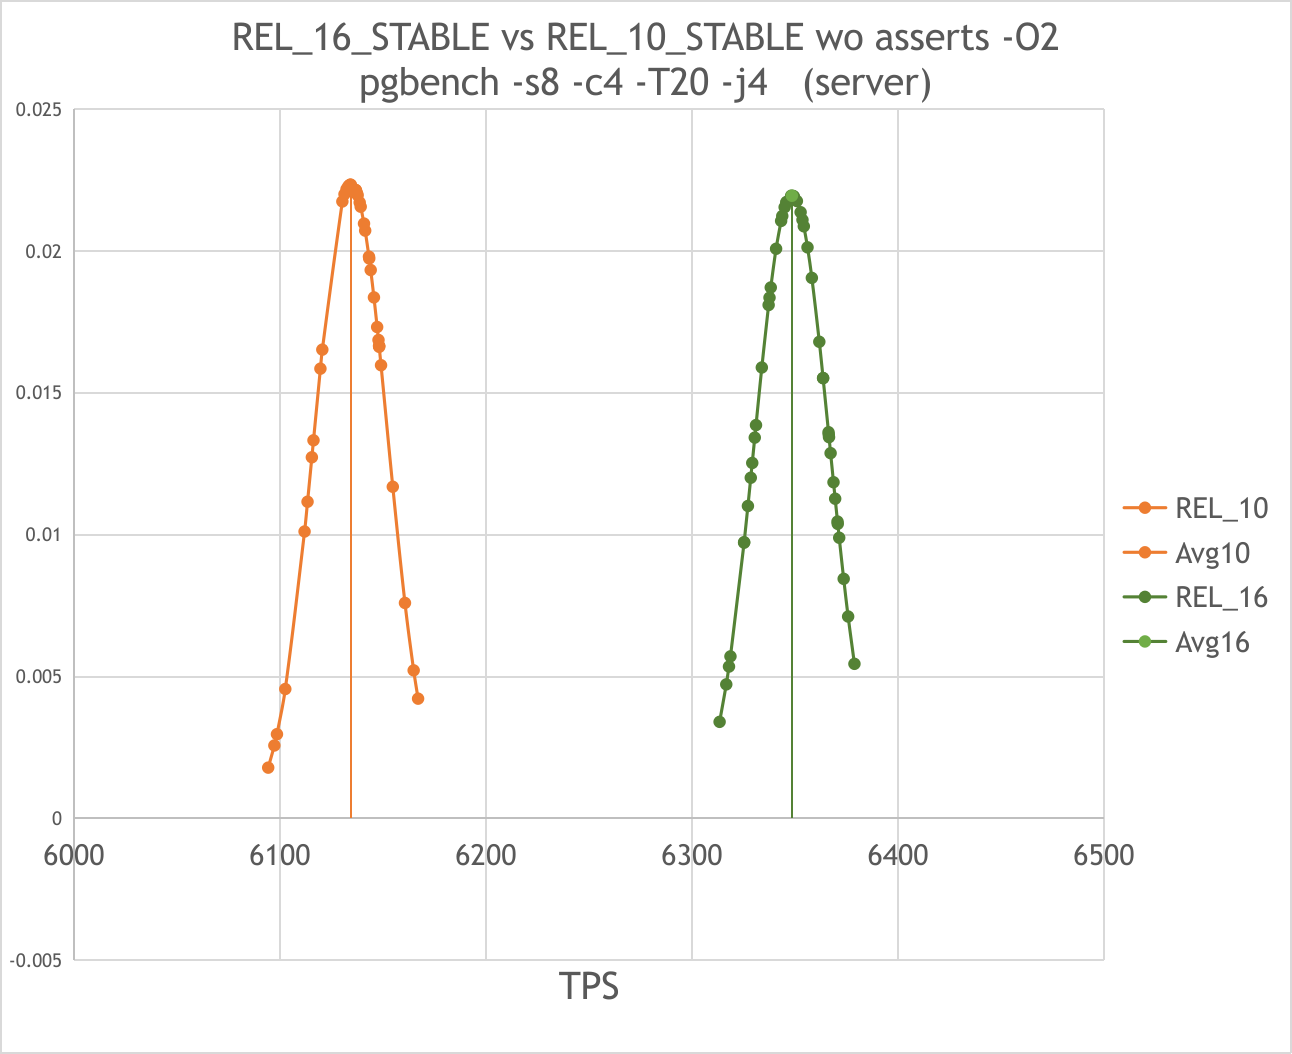
On the server:
REL_10_STABLE gives ~6130 TPS(+-0.3%) while REL_16_STABLE gives ~6350 TPS(+-0.3%) in the test: pgbench -s8 -c4 -T20 -j4
In comparison with previous attempt the standard deviation became smaller by 3 times but difference
in speed remained almost the same:
the 16th is faster than 10th by ~3,6%. See 10vs16-server.png
(previous was ~4% in the pgbench -s8 -c6 -T20 -j6)
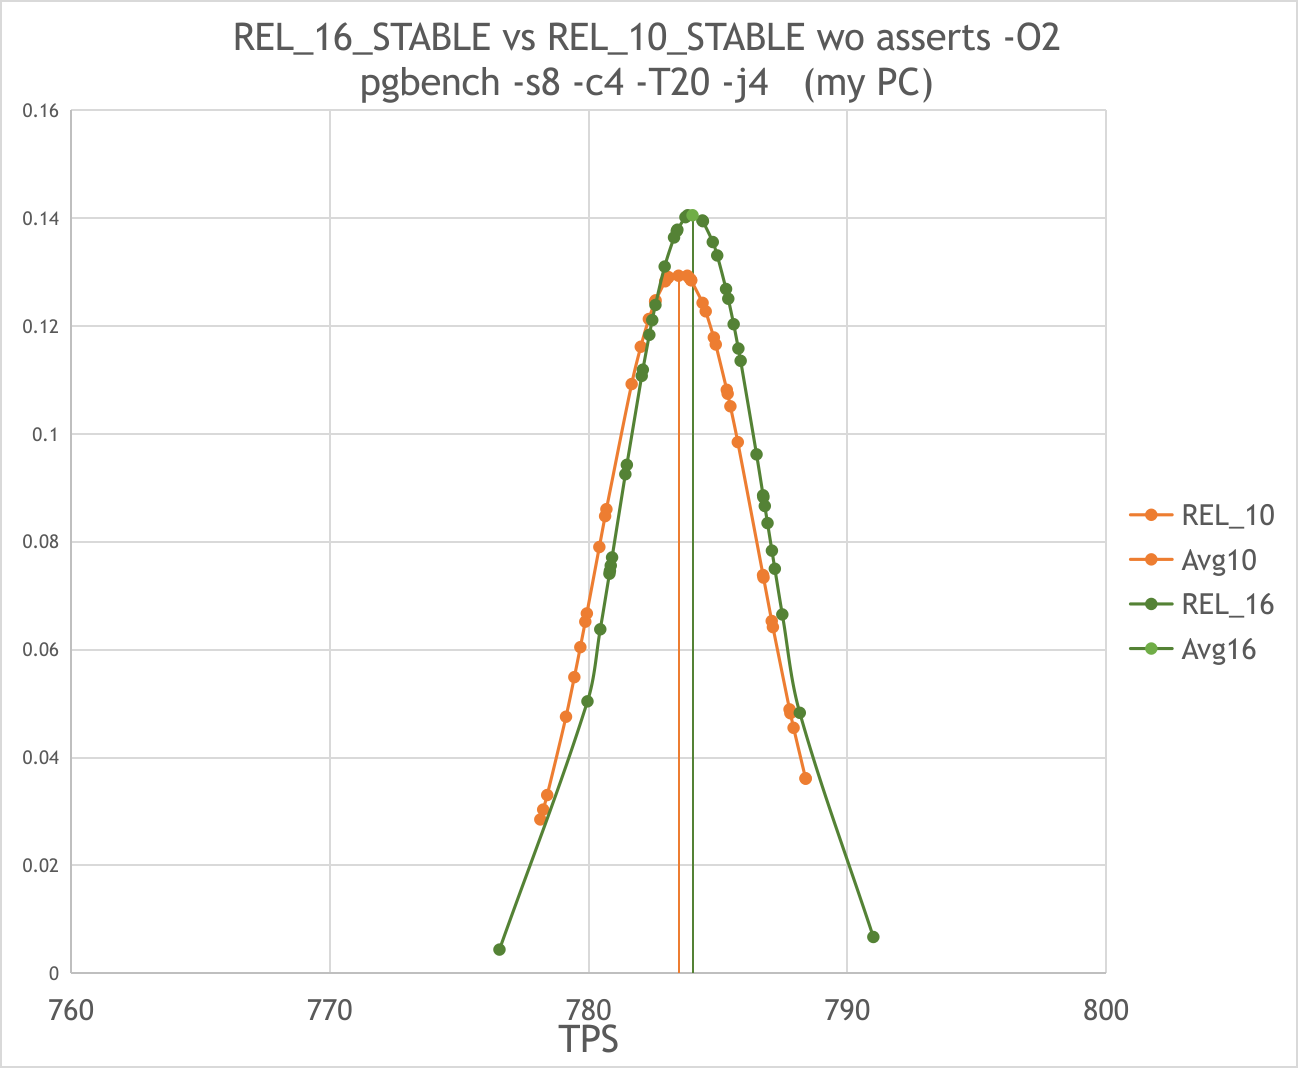
On my pc :
REL_10_STABLE gives ~783 TPS(+-0.4%) while REL_16_STABLE gives ~784 TPS(+-0.4%) in the same test: pgbench -s8 -c4 -T20 -j4
Here the difference in comparison with last attempt is significant. 10th and 16th no longer differ in speed while
the standard deviation became smaller by 5 times. See 10vs16-mypc.png
The results obtained on server seems more reliable as they are consistent with the previous ones
but i would like to figure out why i don’t see a difference in TPS on my PC.
Will be glad to any comments and and concerns.
And want to thank again for the previous advice. Owing to them the measurements have become more stable.
Merry Christmas and the best regards!
--
Anton A. Melnikov
Postgres Professional: http://www.postgrespro.com
The Russian Postgres Company
| Attachment | Content-Type | Size |
|---|---|---|
| server-C1-C1E-falls.mkv | video/x-matroska | 178.0 KB |
| server-stable-freq.mkv | video/x-matroska | 33.5 KB |
| mypc-stable-freq.mkv | video/x-matroska | 42.4 KB |
| server-hw.txt | text/plain | 2.9 KB |
| mypc-hw.txt | text/plain | 2.6 KB |
| raw-server.txt | text/plain | 1.2 KB |
| raw-myPC.txt | text/plain | 1.2 KB |
| 10vs16-server.png | image/png | 89.1 KB |
| 10vs16-mypc.png | image/png | 98.7 KB |
| From | Date | Subject | |
|---|---|---|---|
| Next Message | Andrei Lepikhov | 2023-12-26 04:53:34 | Re: Optimization outcome depends on the index order |
| Previous Message | Richard Guo | 2023-12-26 03:18:16 | Re: Avoid computing ORDER BY junk columns unnecessarily |