Re: Tuplesort merge pre-reading
| From: | Heikki Linnakangas <hlinnaka(at)iki(dot)fi> |
|---|---|
| To: | Peter Geoghegan <pg(at)heroku(dot)com> |
| Cc: | pgsql-hackers <pgsql-hackers(at)postgresql(dot)org>, Claudio Freire <klaussfreire(at)gmail(dot)com> |
| Subject: | Re: Tuplesort merge pre-reading |
| Date: | 2016-09-09 12:01:06 |
| Message-ID: | 03323fef-6d84-e53d-be28-bbfa68cf8751@iki.fi |
| Views: | Whole Thread | Raw Message | Download mbox | Resend email |
| Thread: | |
| Lists: | pgsql-hackers |
(Resending with compressed files, to get below the message size limit of
the list)
On 09/09/2016 02:13 PM, Heikki Linnakangas wrote:
> On 09/08/2016 09:59 PM, Heikki Linnakangas wrote:
>> On 09/06/2016 10:26 PM, Peter Geoghegan wrote:
>>> On Tue, Sep 6, 2016 at 12:08 PM, Peter Geoghegan <pg(at)heroku(dot)com> wrote:
>>>> Offhand, I would think that taken together this is very important. I'd
>>>> certainly want to see cases in the hundreds of megabytes or gigabytes
>>>> of work_mem alongside your 4MB case, even just to be able to talk
>>>> informally about this. As you know, the default work_mem value is very
>>>> conservative.
>>
>> I spent some more time polishing this up, and also added some code to
>> logtape.c, to use larger read buffers, to compensate for the fact that
>> we don't do pre-reading from tuplesort.c anymore. That should trigger
>> the OS read-ahead, and make the I/O more sequential, like was the
>> purpose of the old pre-reading code. But simpler. I haven't tested that
>> part much yet, but I plan to run some tests on larger data sets that
>> don't fit in RAM, to make the I/O effects visible.
>
> Ok, I ran a few tests with 20 GB tables. I thought this would show any
> differences in I/O behaviour, but in fact it was still completely CPU
> bound, like the tests on smaller tables I posted yesterday. I guess I
> need to point temp_tablespaces to a USB drive or something. But here we go.
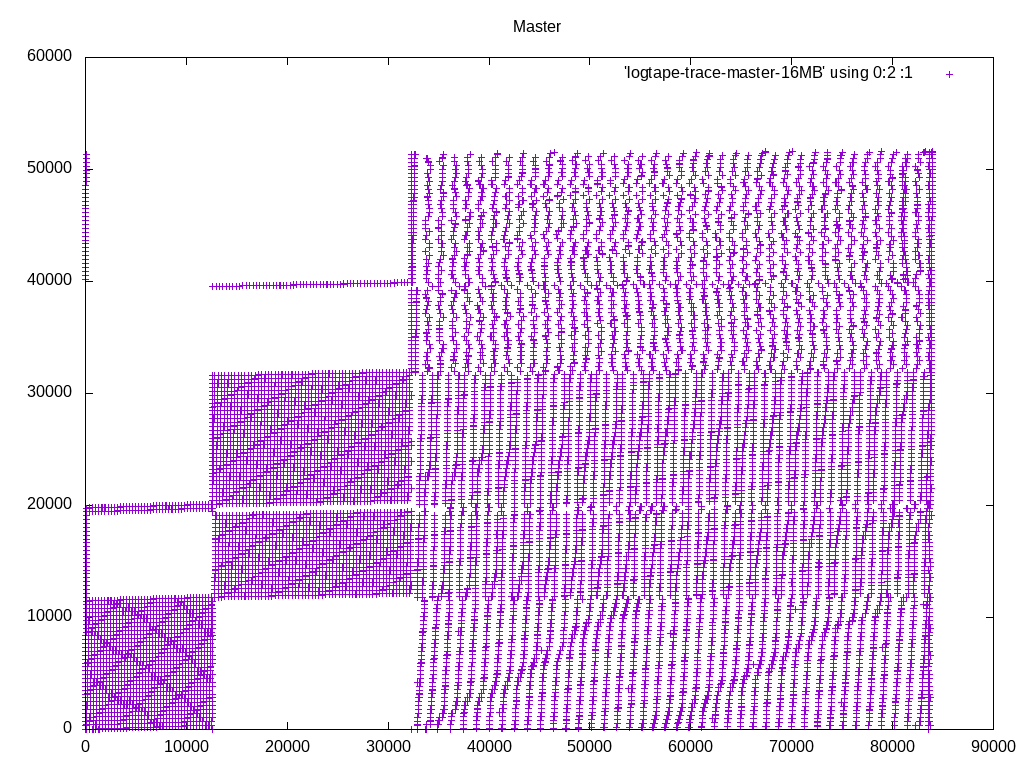
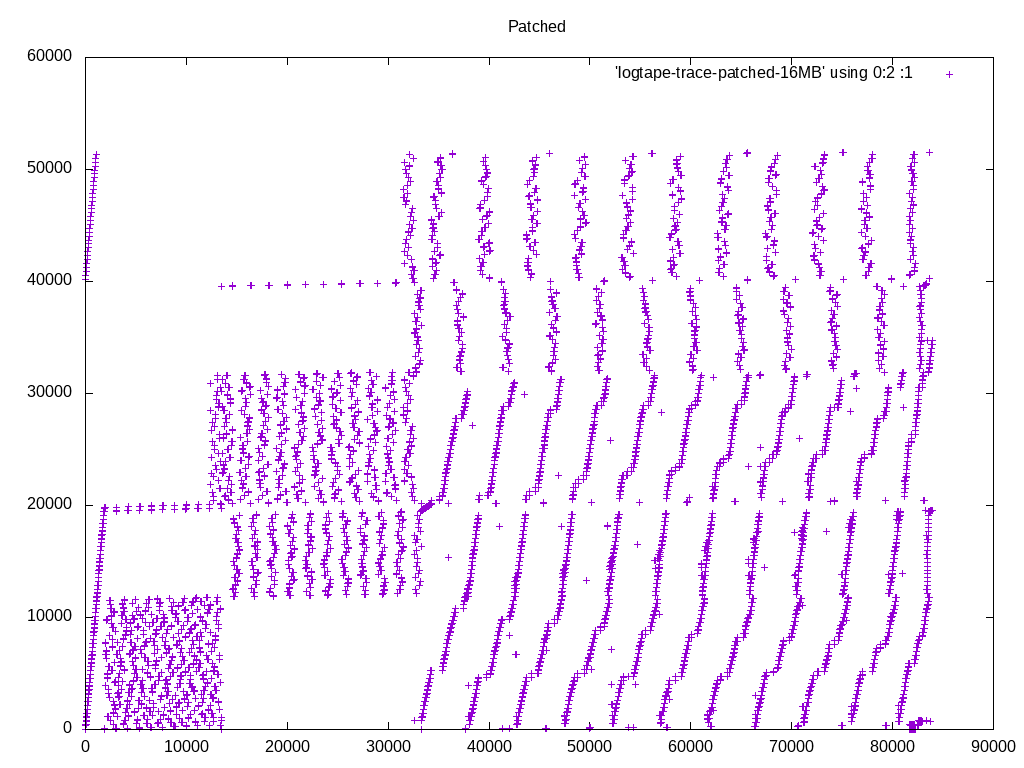
I took a different tact at demonstrating the I/O pattern effects. I
added some instrumentation code to logtape.c, that prints a line to a
file whenever it reads a block, with the block number. I ran the same
query with master and with these patches, and plotted the access pattern
with gnuplot.
I'm happy with what it looks like. We are in fact getting a more
sequential access pattern with these patches, because we're not
expanding the pre-read tuples into SortTuples. Keeping densely-packed
blocks in memory, instead of SortTuples, allows caching more data overall.
Attached is the patch I used to generate these traces, the gnuplot
script, and traces from I got from sorting a 1 GB table of random
integers, with work_mem=16MB.
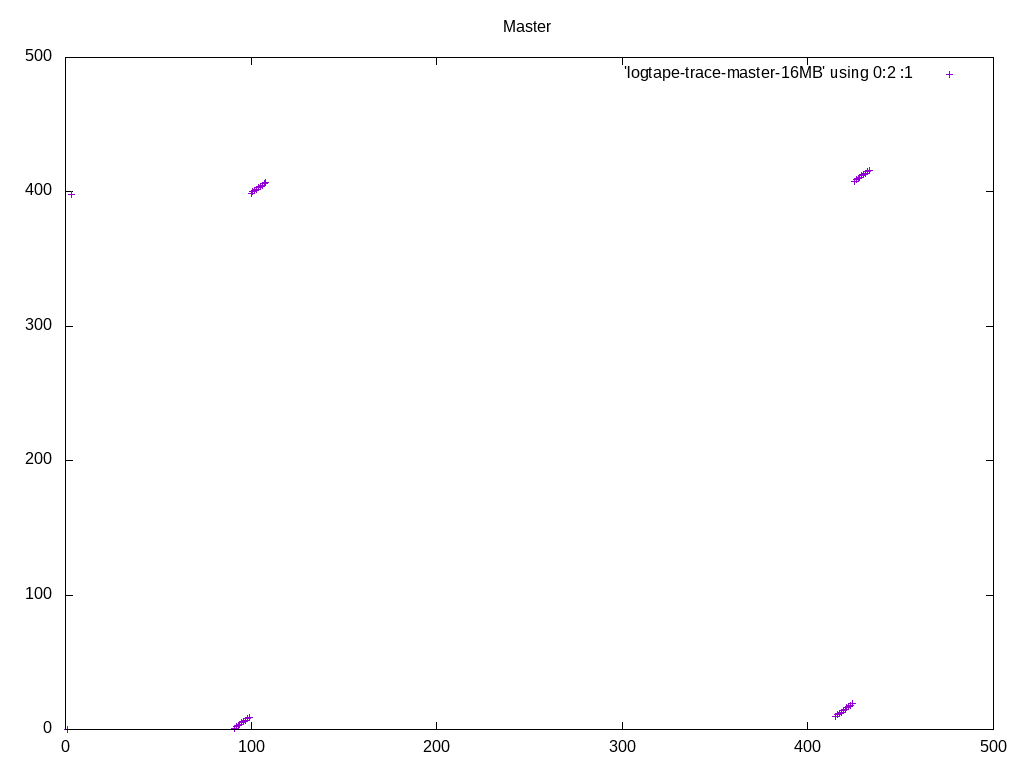
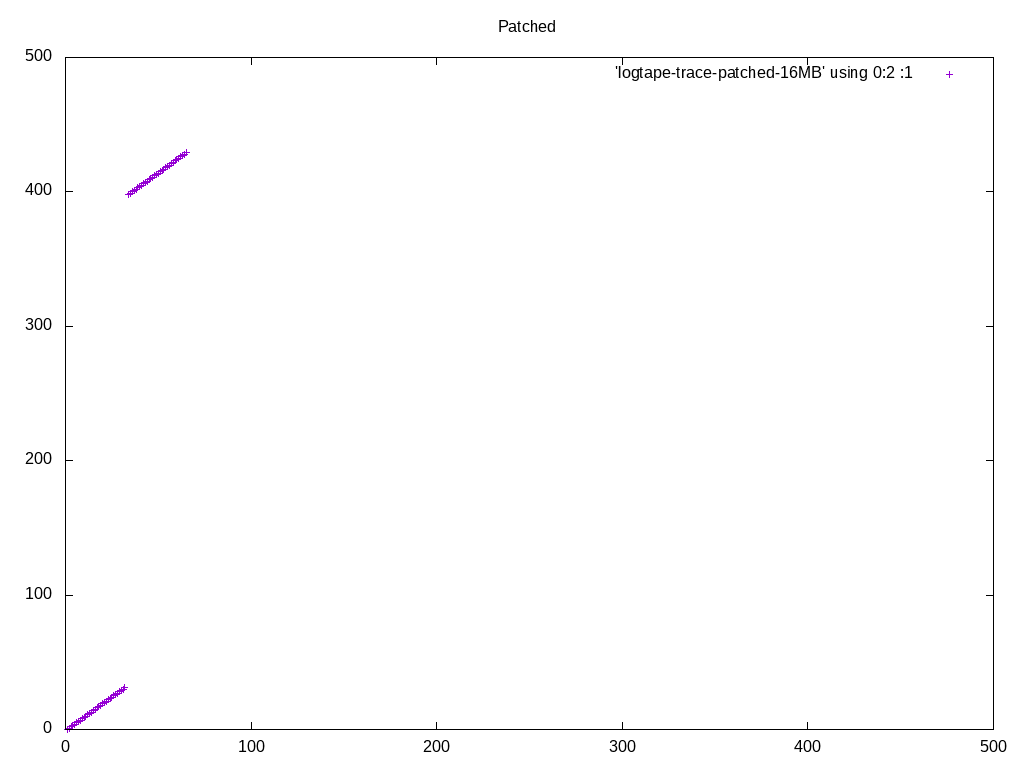
Note that in the big picture, what appear to be individual dots, are
actually clusters of a bunch of dots. So the access pattern is a lot
more sequential than it looks like at first glance, with or without
these patches. The zoomed-in pictures show that. If you want to inspect
these in more detail, I recommend running gnuplot in interactive mode,
so that you can zoom in and out easily.
I'm happy with the amount of testing I've done now, and the results.
Does anyone want to throw out any more test cases where there might be a
regression? If not, let's get these reviewed and committed.
- Heikki
| Attachment | Content-Type | Size |
|---|---|---|
| trace-logtape.patch | text/x-diff | 2.4 KB |

|
image/png | 26.1 KB |

|
image/png | 5.7 KB |

|
image/png | 23.6 KB |

|
image/png | 5.8 KB |
| logtape.plot | text/plain | 304 bytes |
| logtape-trace-master-16MB.xz | application/x-xz | 43.8 KB |
| logtape-trace-patched-16MB.xz | application/x-xz | 29.9 KB |
In response to
- Re: Tuplesort merge pre-reading at 2016-09-09 11:13:49 from Heikki Linnakangas
Responses
- Re: Tuplesort merge pre-reading at 2016-09-09 12:25:29 from Greg Stark
Browse pgsql-hackers by date
| From | Date | Subject | |
|---|---|---|---|
| Next Message | Simon Riggs | 2016-09-09 12:12:34 | pgsql: Fix corruption of 2PC recovery with subxacts |
| Previous Message | Tom Lane | 2016-09-09 11:57:12 | Re: Re: GiST optimizing memmoves in gistplacetopage for fixed-size updates [PoC] |