Re: checkpointer continuous flushing
| From: | Tomas Vondra <tomas(dot)vondra(at)2ndquadrant(dot)com> |
|---|---|
| To: | Fabien COELHO <coelho(at)cri(dot)ensmp(dot)fr> |
| Cc: | PostgreSQL Developers <pgsql-hackers(at)postgresql(dot)org> |
| Subject: | Re: checkpointer continuous flushing |
| Date: | 2016-03-21 17:46:58 |
| Message-ID: | 0563fa5f-ef38-47d7-2baf-713c2171dd7c@2ndquadrant.com |
| Views: | Whole Thread | Raw Message | Download mbox | Resend email |
| Thread: | |
| Lists: | pgsql-hackers |
Hi,
I've repeated the tests, but this time logged details for 5% of the
transaction (instead of aggregating the data for each second). I've also
made the tests shorter - just 12 hours instead of 24, to reduce the time
needed to complete the benchmark.
Overall, this means ~300M transactions in total for the un-throttled
case, so sample with ~15M transactions available when computing the
following charts.
I've used the same commits as during the previous testing, i.e. a298a1e0
(before patches) and 23a27b03 (with patches).
One interesting difference is that while the "patched" version resulted
in slightly better performance (8122 vs. 8000 tps), the "unpatched"
version got considerably slower (6790 vs. 7725 tps) - that's ~13%
difference, so not negligible. Not sure what's the cause - the
configuration was exactly the same, there's nothing in the log and the
machine was dedicated to the testing. The only explanation I have is
that the unpatched code is a bit more unstable when it comes to this
type of stress testing.
There results (including scripts for generating the charts) are here:
https://github.com/tvondra/flushing-benchmark-2
Attached are three charts - again, those are using CDF to illustrate the
distributions and compare them easily:
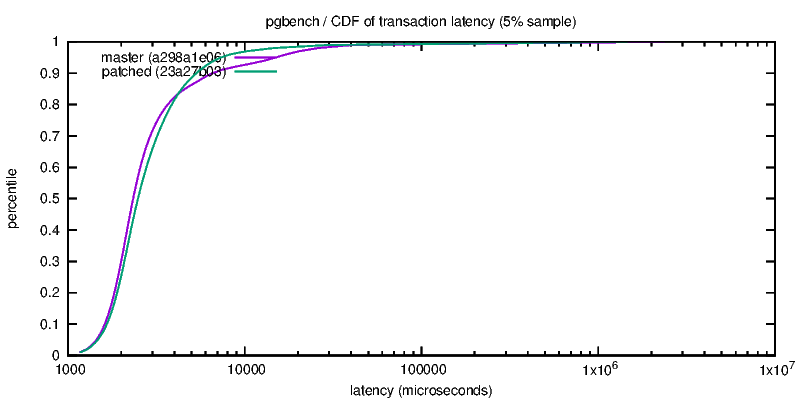
1) regular-latency.png
The two curves intersect at ~4ms, where both CDF reach ~85%. For the
shorter transactions, the old code is slightly faster (i.e. apparently
there's some per-transaction overhead). For higher latencies though, the
patched code is clearly winning - there are far fewer transactions over
6ms, which makes a huge difference. (Notice the x-axis is actually
log-scale, so the tail on the old code is actually much longer than it
might appear.)
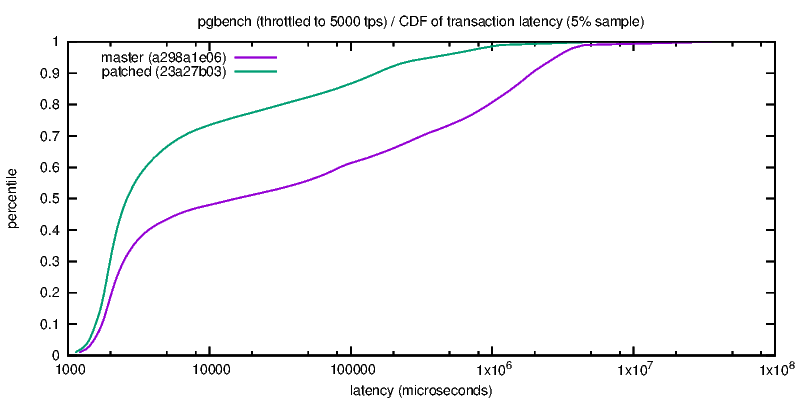
2) throttled-latency.png
In the throttled case (i.e. when the system is not 100% utilized, so
it's more representative of actual production use), the difference is
quite clearly in favor of the new code.
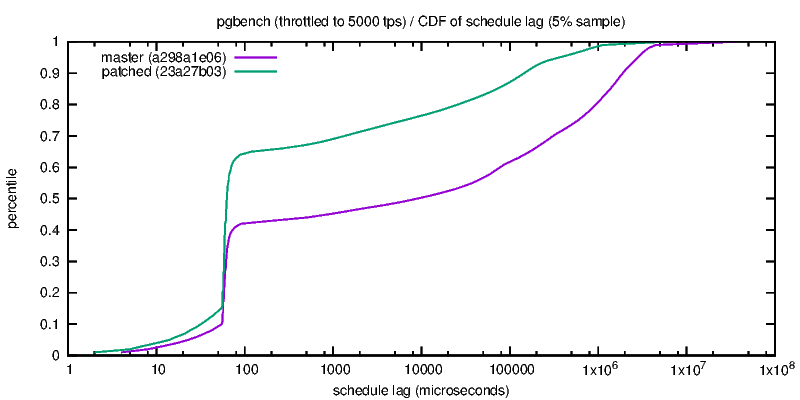
3) throttled-schedule-lag.png
Mostly just an alternative view on the previous chart, showing how much
later the transactions were scheduled. Again, the new code is winning.
regards
--
Tomas Vondra http://www.2ndQuadrant.com
PostgreSQL Development, 24x7 Support, Remote DBA, Training & Services
| Attachment | Content-Type | Size |
|---|---|---|
|
image/png | 11.9 KB |
|
image/png | 12.0 KB |
|
image/png | 11.8 KB |
In response to
- Re: checkpointer continuous flushing at 2016-03-18 08:07:38 from Fabien COELHO
Responses
- Re: checkpointer continuous flushing at 2016-03-22 06:35:06 from Fabien COELHO
- Re: checkpointer continuous flushing at 2016-03-22 09:18:52 from Andres Freund
Browse pgsql-hackers by date
| From | Date | Subject | |
|---|---|---|---|
| Next Message | David G. Johnston | 2016-03-21 18:09:02 | Re: Request - repeat value of \pset title during \watch interations |
| Previous Message | Tom Lane | 2016-03-21 17:42:20 | Re: [GENERAL] Request - repeat value of \pset title during \watch interations |